

Question: CONFIDENCE INTERVAL This is your sample! After you have found the Frequency and Relative Frequency of each color, find the Estimated the proportion of EACH
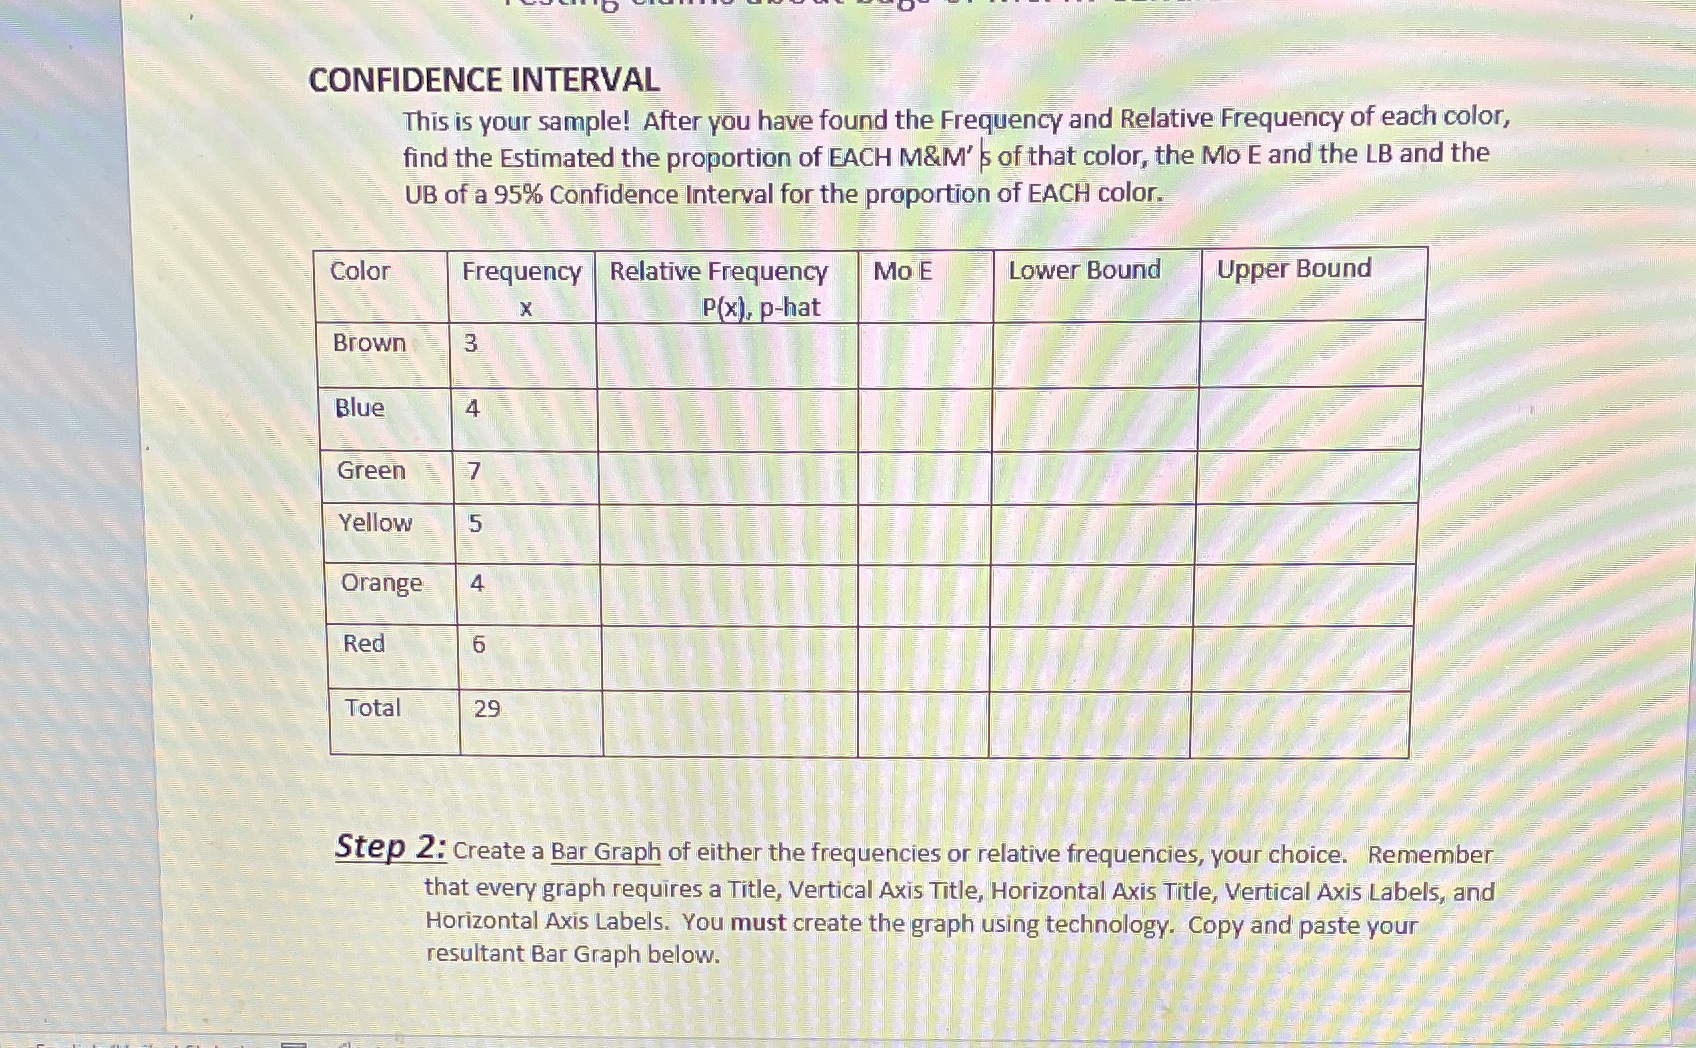

CONFIDENCE INTERVAL This is your sample! After you have found the Frequency and Relative Frequency of each color, find the Estimated the proportion of EACH M&M's of that color, the Mo E and the LB and the UB of a 95% Confidence Interval for the proportion of EACH color. Color Frequency Relative Frequency Mo E Lower Bound Upper Bound X P(x), p-hat Brown Blue 4 Green 7 Yellow 5 Orange 4 Red Total 29 Step 2: Create a Bar Graph of either the frequencies or relative frequencies, your choice. Remember that every graph requires a Title, Vertical Axis Title, Horizontal Axis Title, Vertical Axis Labels, and Horizontal Axis Labels. You must create the graph using technology. Copy and paste your resultant Bar Graph below
Step by Step Solution
There are 3 Steps involved in it

Get step-by-step solutions from verified subject matter experts