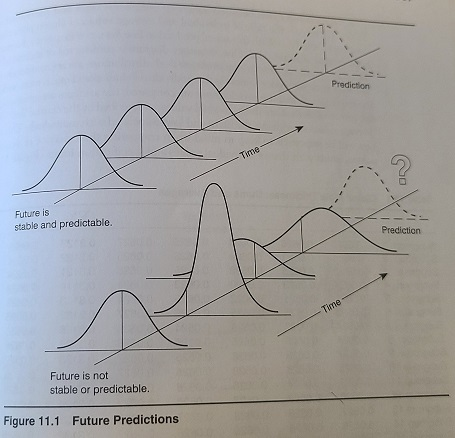
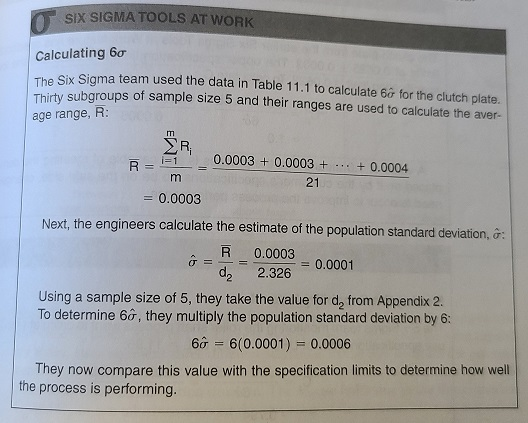
Question: Confirm the calculation for the table as the calculations shown in the example. Show your work. Prediction Time ? Future is stable and predictable. Prediction

Confirm the calculation for the table as the calculations shown in the example. Show your work.

Confirm the calculation for the table as the

Confirm the calculation for the table as the

Prediction Time ? Future is stable and predictable. Prediction Time Future is not stable or predictable. Figure 11.1 Future Predictions SIX SIGMA TOOLS AT WORK Calculating 60 age range, R: The Six Sigma team used the data in Table 11.1 to calculate 6a for the clutch plate. Thirty subgroups of sample size 5 and their ranges are used to calculate the aver- , 0.0003 + 0.0003 + R = i=1 m ... + 0.0004 21 = 0.0003 Next, the engineers calculate the estimate of the population standard deviation, a: R 0.0003 = 0.0001 dz 2.326 Using a sample size of 5, they take the value for d, from Appendix 2. To determine 66, they multiply the population standard deviation by 6: 6 = 600.0001) = 0.0006 They now compare this value with the specification limits to determine how well the process is performing

Step by Step Solution

There are 3 Steps involved in it

1 Expert Approved Answer
Step: 1 Unlock blur-text-image
Question Has Been Solved by an Expert!

Get step-by-step solutions from verified subject matter experts

Step: 2 Unlock
Step: 3 Unlock

Students Have Also Explored These Related General Management Questions!