

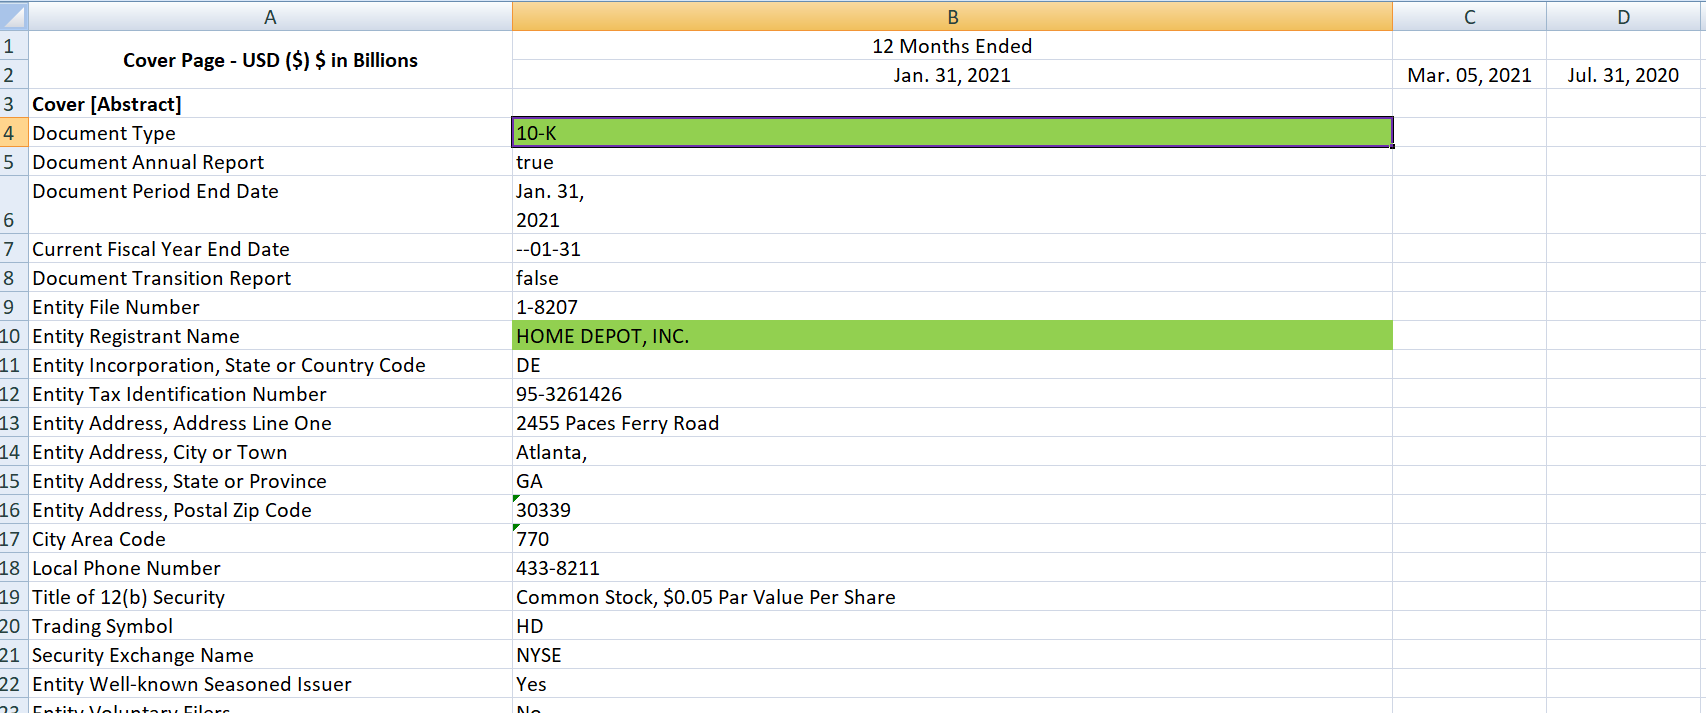
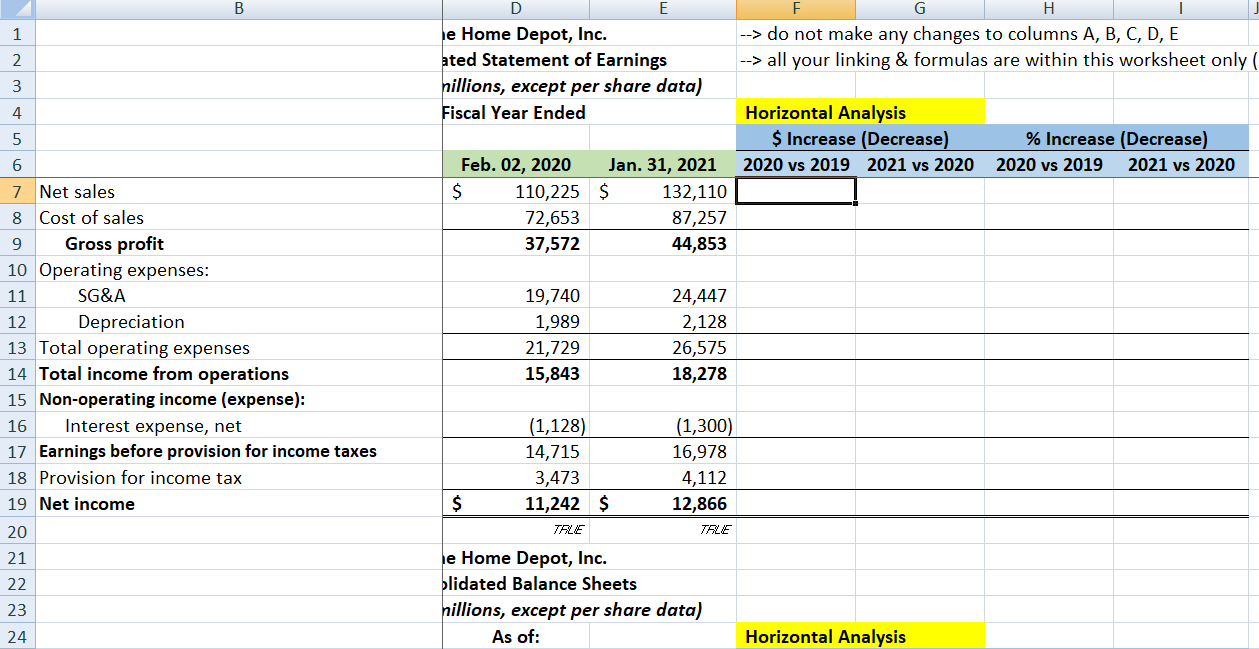
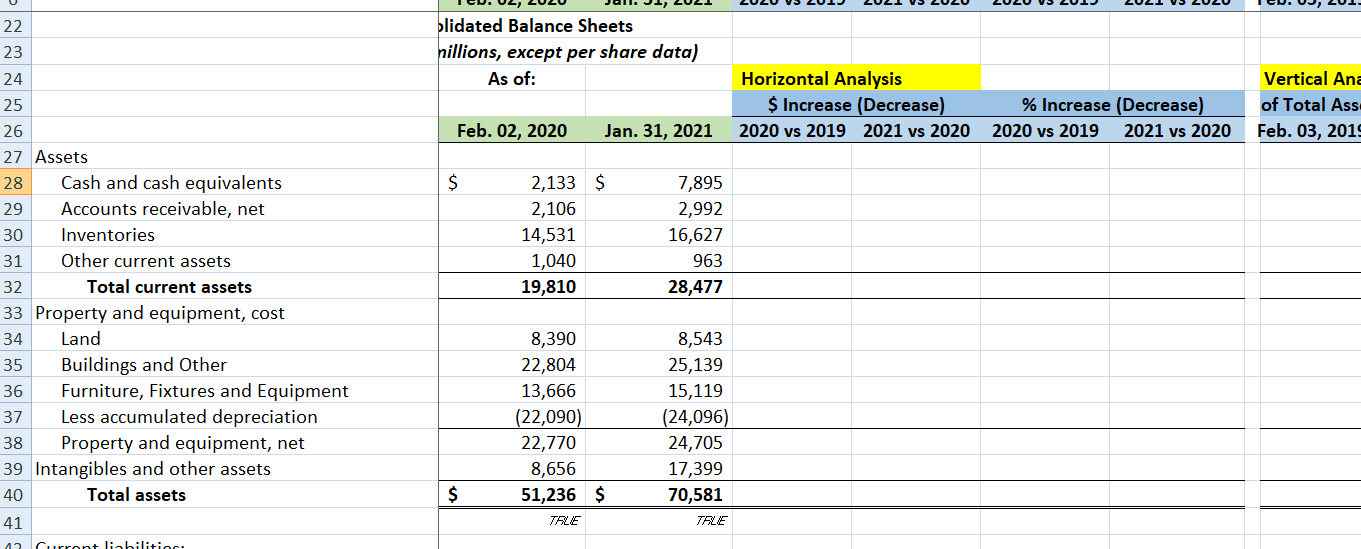
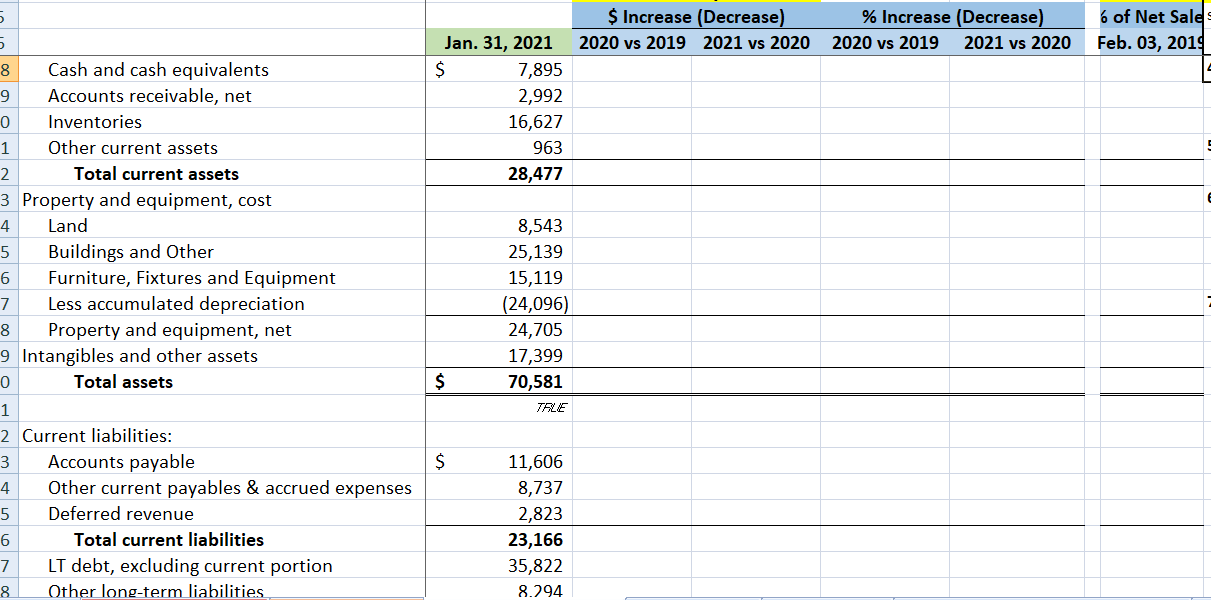
Question: CONFUSED PLEASE HELP ON THIS PROBLEM A Cover Page - USD ($) $ in Billions 1 2 3 Cover [Abstract] 4 Document Type 5 Document
![($) $ in Billions 1 2 3 Cover [Abstract] 4 Document Type](https://dsd5zvtm8ll6.cloudfront.net/si.experts.images/questions/2024/10/6717f70ed07a1_8226717f70e7352b.jpg)
CONFUSED PLEASE HELP ON THIS PROBLEM
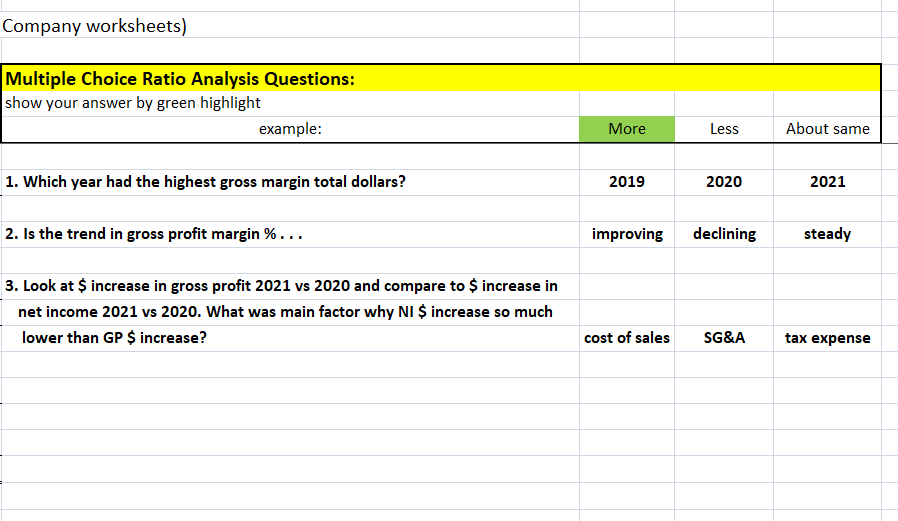
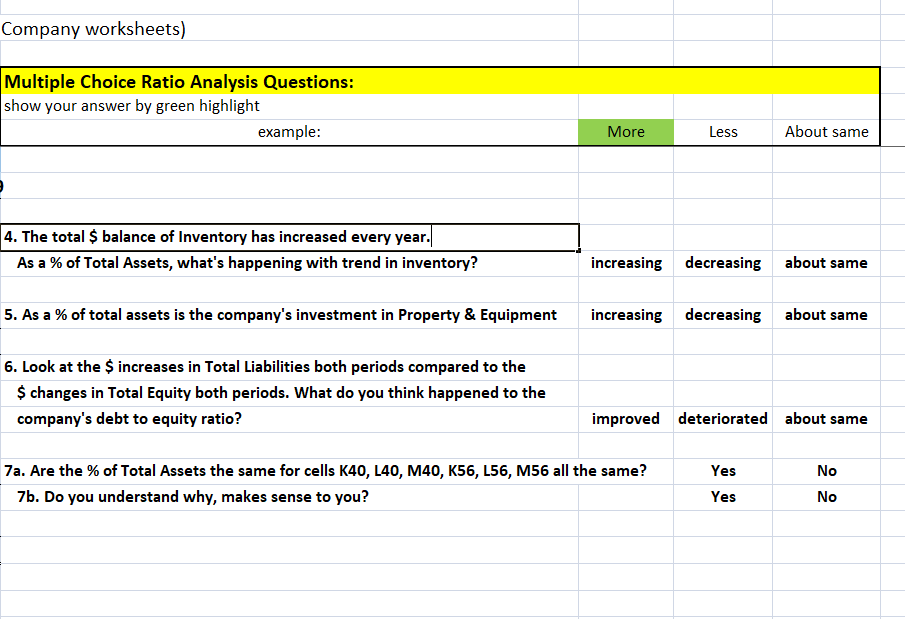
A Cover Page - USD ($) $ in Billions 1 2 3 Cover [Abstract] 4 Document Type 5 Document Annual Report Document Period End Date 6 7 Current Fiscal Year End Date 8 Document Transition Report 9 Entity File Number 10 Entity Registrant Name 11 Entity Incorporation, State or Country Code 12 Entity Tax Identification Number 13 Entity Address, Address Line One 14 Entity Address, City or Town 15 Entity Address, State or Province 16 Entity Address, Postal Zip Code 17 City Area Code 18 Local Phone Number 19 Title of 12(b) Security 20 Trading Symbol 21 Security Exchange Name 22 Entity Well-known Seasoned Issuer 22 Entity Voluntary Filor B 12 Months Ended Jan. 31, 2021 10-K true Jan. 31, 2021 --01-31 false 1-8207 HOME DEPOT, INC. DE 95-3261426 2455 Paces Ferry Road Atlanta, GA 30339 770 433-8211 Common Stock, $0.05 Par Value Per Share HD NYSE Yes Na Mar. 05, 2021 D Jul. 31, 2020 22 Entity Well-known Seasoned Issuer 23 Entity Voluntary Filers 24 Entity Current Reporting Status 25 Entity Interactive Data Current 26 Entity Filer Category 27 Entity Small Business 28 Entity Emerging Growth Company 29 ICFR Auditor Attestation Flag 30 Entity Shell Company 31 Entity Public Float 32 Entity Common Stock, Shares Outstanding Documents Incorporated by Reference 33 34 Amendment Flag 35 Document Fiscal Year Focus 36 Document Fiscal Period Focus 37 Entity Central Index Key 38 39 40 Yes No Yes Yes Large Accelerated Filer false false true false Portions of the registrant's proxy statement for the 2021 Annual Meeting of Shareholders are incorporated by reference in Part III of this Form 10-K to the extent described herein. false 2020 0000354950 1,077,069,383 $ 285.6 B 1 2 3 4 5 6 7 Net sales 8 Cost of sales 9 Gross profit 10 Operating expenses: 11 SG&A 12 Depreciation 13 Total operating expenses 14 Total income from operations 15 Non-operating income (expense): 16 Interest expense, net 17 Earnings before provision for income taxes 18 Provision for income tax 19 Net income 20 21 22 23 24 E e Home Depot, Inc. ated Statement of Earnings millions, except per share data) Fiscal Year Ended Feb. 02, 2020 Jan. 31, 2021 132,110 87,257 44,853 24,447 2,128 26,575 18,278 (1,300) 16,978 4,112 12,866 110,225 $ 72,653 37,572 19,740 1,989 21,729 15,843 (1,128) 14,715 3,473 $ 11,242 $ TALE e Home Depot, Inc. olidated Balance Sheets millions, except per share data) As of: $ TALE --> do not make any changes to columns A, B, C, D, E --> all your linking & formulas are within this worksheet only ( Horizontal Analysis % Increase (Decrease) $ Increase (Decrease) 2020 vs 2019 2021 vs 2020 Horizontal Analysis 2020 vs 2019 2021 vs 2020 22 23 24 25 26 27 Assets 28 Cash and cash equivalents 29 Accounts receivable, net Inventories 30 31 Other current assets 32 Total current assets 33 Property and equipment, cost 34 Land 35 Buildings and Other 36 Furniture, Fixtures and Equipment 37 Less accumulated depreciation 38 Property and equipment, net 39 Intangibles and other assets 40 Total assets 41 12 Curront liabilition olidated Balance Sheets nillions, except per share data) As of: Feb. 02, 2020 Jan. 31, 2021 $ 2,133 $ 2,106 7,895 2,992 16,627 963 28,477 8,543 25,139 15,119 (24,096) 24,705 17,399 70,581 $ 14,531 1,040 19,810 8,390 22,804 13,666 (22,090) 22,770 8,656 51,236 $ TALE TALE Horizontal Analysis $ Increase (Decrease) 2020 vs 2019 2021 vs 2020 % Increase (Decrease) 2020 vs 2019 2021 vs 2020 Vertical Ana of Total Ass Feb. 03, 2019 5 5 Jan. 31, 2021 $ 8 Cash and cash equivalents 9 Accounts receivable, net Inventories 0 1 Other current assets 2 Total current assets 3 Property and equipment, cost 4 Land 5 Buildings and Other 6 Furniture, Fixtures and Equipment 7 Less accumulated depreciation 8 Property and equipment, net 9 Intangibles and other assets 0 Total assets $ 1 2 Current liabilities: 3 Accounts payable $ 4 Other current payables & accrued expenses 5 Deferred revenue 6 Total current liabilities 7 LT debt, excluding current portion 8 Other long-term liabilities 7,895 2,992 16,627 963 28,477 8,543 25,139 15,119 (24,096) 24,705 17,399 70,581 TALE 11,606 8,737 2,823 23,166 35,822 8.294 $ Increase (Decrease) 2020 vs 2019 2021 vs 2020 % Increase (Decrease) 2020 vs 2019 2021 vs 2020 6 of Net Sale Feb. 03, 2019 Company worksheets) Multiple Choice Ratio Analysis Questions: show your answer by green highlight example: 1. Which year had the highest gross margin total dollars? 2. Is the trend in gross profit margin %... 3. Look at $ increase in gross profit 2021 vs 2020 and compare to $ increase in net income 2021 vs 2020. What was main factor why NI $ increase so much lower than GP $ increase? More 2019 improving cost of sales Less 2020 declining SG&A About same 2021 steady tax expense Company worksheets) Multiple Choice Ratio Analysis Questions: show your answer by green highlight example: 4. The total $ balance of Inventory has increased every year. As a % of Total Assets, what's happening with trend in inventory? 5. As a % of total assets is the company's investment in Property & Equipment 6. Look at the $ increases in Total Liabilities both periods compared to the $ changes in Total Equity both periods. What do you think happened to the company's debt to equity ratio? 7a. Are the % of Total Assets the same for cells K40, L40, M40, K56, L56, M56 all the same? 7b. Do you understand why, makes sense to you? More Less About same increasing decreasing about same increasing decreasing about same improved deteriorated about same Yes No Yes No A Cover Page - USD ($) $ in Billions 1 2 3 Cover [Abstract] 4 Document Type 5 Document Annual Report Document Period End Date 6 7 Current Fiscal Year End Date 8 Document Transition Report 9 Entity File Number 10 Entity Registrant Name 11 Entity Incorporation, State or Country Code 12 Entity Tax Identification Number 13 Entity Address, Address Line One 14 Entity Address, City or Town 15 Entity Address, State or Province 16 Entity Address, Postal Zip Code 17 City Area Code 18 Local Phone Number 19 Title of 12(b) Security 20 Trading Symbol 21 Security Exchange Name 22 Entity Well-known Seasoned Issuer 22 Entity Voluntary Filor B 12 Months Ended Jan. 31, 2021 10-K true Jan. 31, 2021 --01-31 false 1-8207 HOME DEPOT, INC. DE 95-3261426 2455 Paces Ferry Road Atlanta, GA 30339 770 433-8211 Common Stock, $0.05 Par Value Per Share HD NYSE Yes Na Mar. 05, 2021 D Jul. 31, 2020 22 Entity Well-known Seasoned Issuer 23 Entity Voluntary Filers 24 Entity Current Reporting Status 25 Entity Interactive Data Current 26 Entity Filer Category 27 Entity Small Business 28 Entity Emerging Growth Company 29 ICFR Auditor Attestation Flag 30 Entity Shell Company 31 Entity Public Float 32 Entity Common Stock, Shares Outstanding Documents Incorporated by Reference 33 34 Amendment Flag 35 Document Fiscal Year Focus 36 Document Fiscal Period Focus 37 Entity Central Index Key 38 39 40 Yes No Yes Yes Large Accelerated Filer false false true false Portions of the registrant's proxy statement for the 2021 Annual Meeting of Shareholders are incorporated by reference in Part III of this Form 10-K to the extent described herein. false 2020 0000354950 1,077,069,383 $ 285.6 B 1 2 3 4 5 6 7 Net sales 8 Cost of sales 9 Gross profit 10 Operating expenses: 11 SG&A 12 Depreciation 13 Total operating expenses 14 Total income from operations 15 Non-operating income (expense): 16 Interest expense, net 17 Earnings before provision for income taxes 18 Provision for income tax 19 Net income 20 21 22 23 24 E e Home Depot, Inc. ated Statement of Earnings millions, except per share data) Fiscal Year Ended Feb. 02, 2020 Jan. 31, 2021 132,110 87,257 44,853 24,447 2,128 26,575 18,278 (1,300) 16,978 4,112 12,866 110,225 $ 72,653 37,572 19,740 1,989 21,729 15,843 (1,128) 14,715 3,473 $ 11,242 $ TALE e Home Depot, Inc. olidated Balance Sheets millions, except per share data) As of: $ TALE --> do not make any changes to columns A, B, C, D, E --> all your linking & formulas are within this worksheet only ( Horizontal Analysis % Increase (Decrease) $ Increase (Decrease) 2020 vs 2019 2021 vs 2020 Horizontal Analysis 2020 vs 2019 2021 vs 2020 22 23 24 25 26 27 Assets 28 Cash and cash equivalents 29 Accounts receivable, net Inventories 30 31 Other current assets 32 Total current assets 33 Property and equipment, cost 34 Land 35 Buildings and Other 36 Furniture, Fixtures and Equipment 37 Less accumulated depreciation 38 Property and equipment, net 39 Intangibles and other assets 40 Total assets 41 12 Curront liabilition olidated Balance Sheets nillions, except per share data) As of: Feb. 02, 2020 Jan. 31, 2021 $ 2,133 $ 2,106 7,895 2,992 16,627 963 28,477 8,543 25,139 15,119 (24,096) 24,705 17,399 70,581 $ 14,531 1,040 19,810 8,390 22,804 13,666 (22,090) 22,770 8,656 51,236 $ TALE TALE Horizontal Analysis $ Increase (Decrease) 2020 vs 2019 2021 vs 2020 % Increase (Decrease) 2020 vs 2019 2021 vs 2020 Vertical Ana of Total Ass Feb. 03, 2019 5 5 Jan. 31, 2021 $ 8 Cash and cash equivalents 9 Accounts receivable, net Inventories 0 1 Other current assets 2 Total current assets 3 Property and equipment, cost 4 Land 5 Buildings and Other 6 Furniture, Fixtures and Equipment 7 Less accumulated depreciation 8 Property and equipment, net 9 Intangibles and other assets 0 Total assets $ 1 2 Current liabilities: 3 Accounts payable $ 4 Other current payables & accrued expenses 5 Deferred revenue 6 Total current liabilities 7 LT debt, excluding current portion 8 Other long-term liabilities 7,895 2,992 16,627 963 28,477 8,543 25,139 15,119 (24,096) 24,705 17,399 70,581 TALE 11,606 8,737 2,823 23,166 35,822 8.294 $ Increase (Decrease) 2020 vs 2019 2021 vs 2020 % Increase (Decrease) 2020 vs 2019 2021 vs 2020 6 of Net Sale Feb. 03, 2019 Company worksheets) Multiple Choice Ratio Analysis Questions: show your answer by green highlight example: 1. Which year had the highest gross margin total dollars? 2. Is the trend in gross profit margin %... 3. Look at $ increase in gross profit 2021 vs 2020 and compare to $ increase in net income 2021 vs 2020. What was main factor why NI $ increase so much lower than GP $ increase? More 2019 improving cost of sales Less 2020 declining SG&A About same 2021 steady tax expense Company worksheets) Multiple Choice Ratio Analysis Questions: show your answer by green highlight example: 4. The total $ balance of Inventory has increased every year. As a % of Total Assets, what's happening with trend in inventory? 5. As a % of total assets is the company's investment in Property & Equipment 6. Look at the $ increases in Total Liabilities both periods compared to the $ changes in Total Equity both periods. What do you think happened to the company's debt to equity ratio? 7a. Are the % of Total Assets the same for cells K40, L40, M40, K56, L56, M56 all the same? 7b. Do you understand why, makes sense to you? More Less About same increasing decreasing about same increasing decreasing about same improved deteriorated about same Yes No Yes No
Step by Step Solution
There are 3 Steps involved in it

Get step-by-step solutions from verified subject matter experts