

Question: Connections 9 . The graph of the function f is shown below. Use a right Riemann sum with 3 equal subintervals to estimate the area
Connections
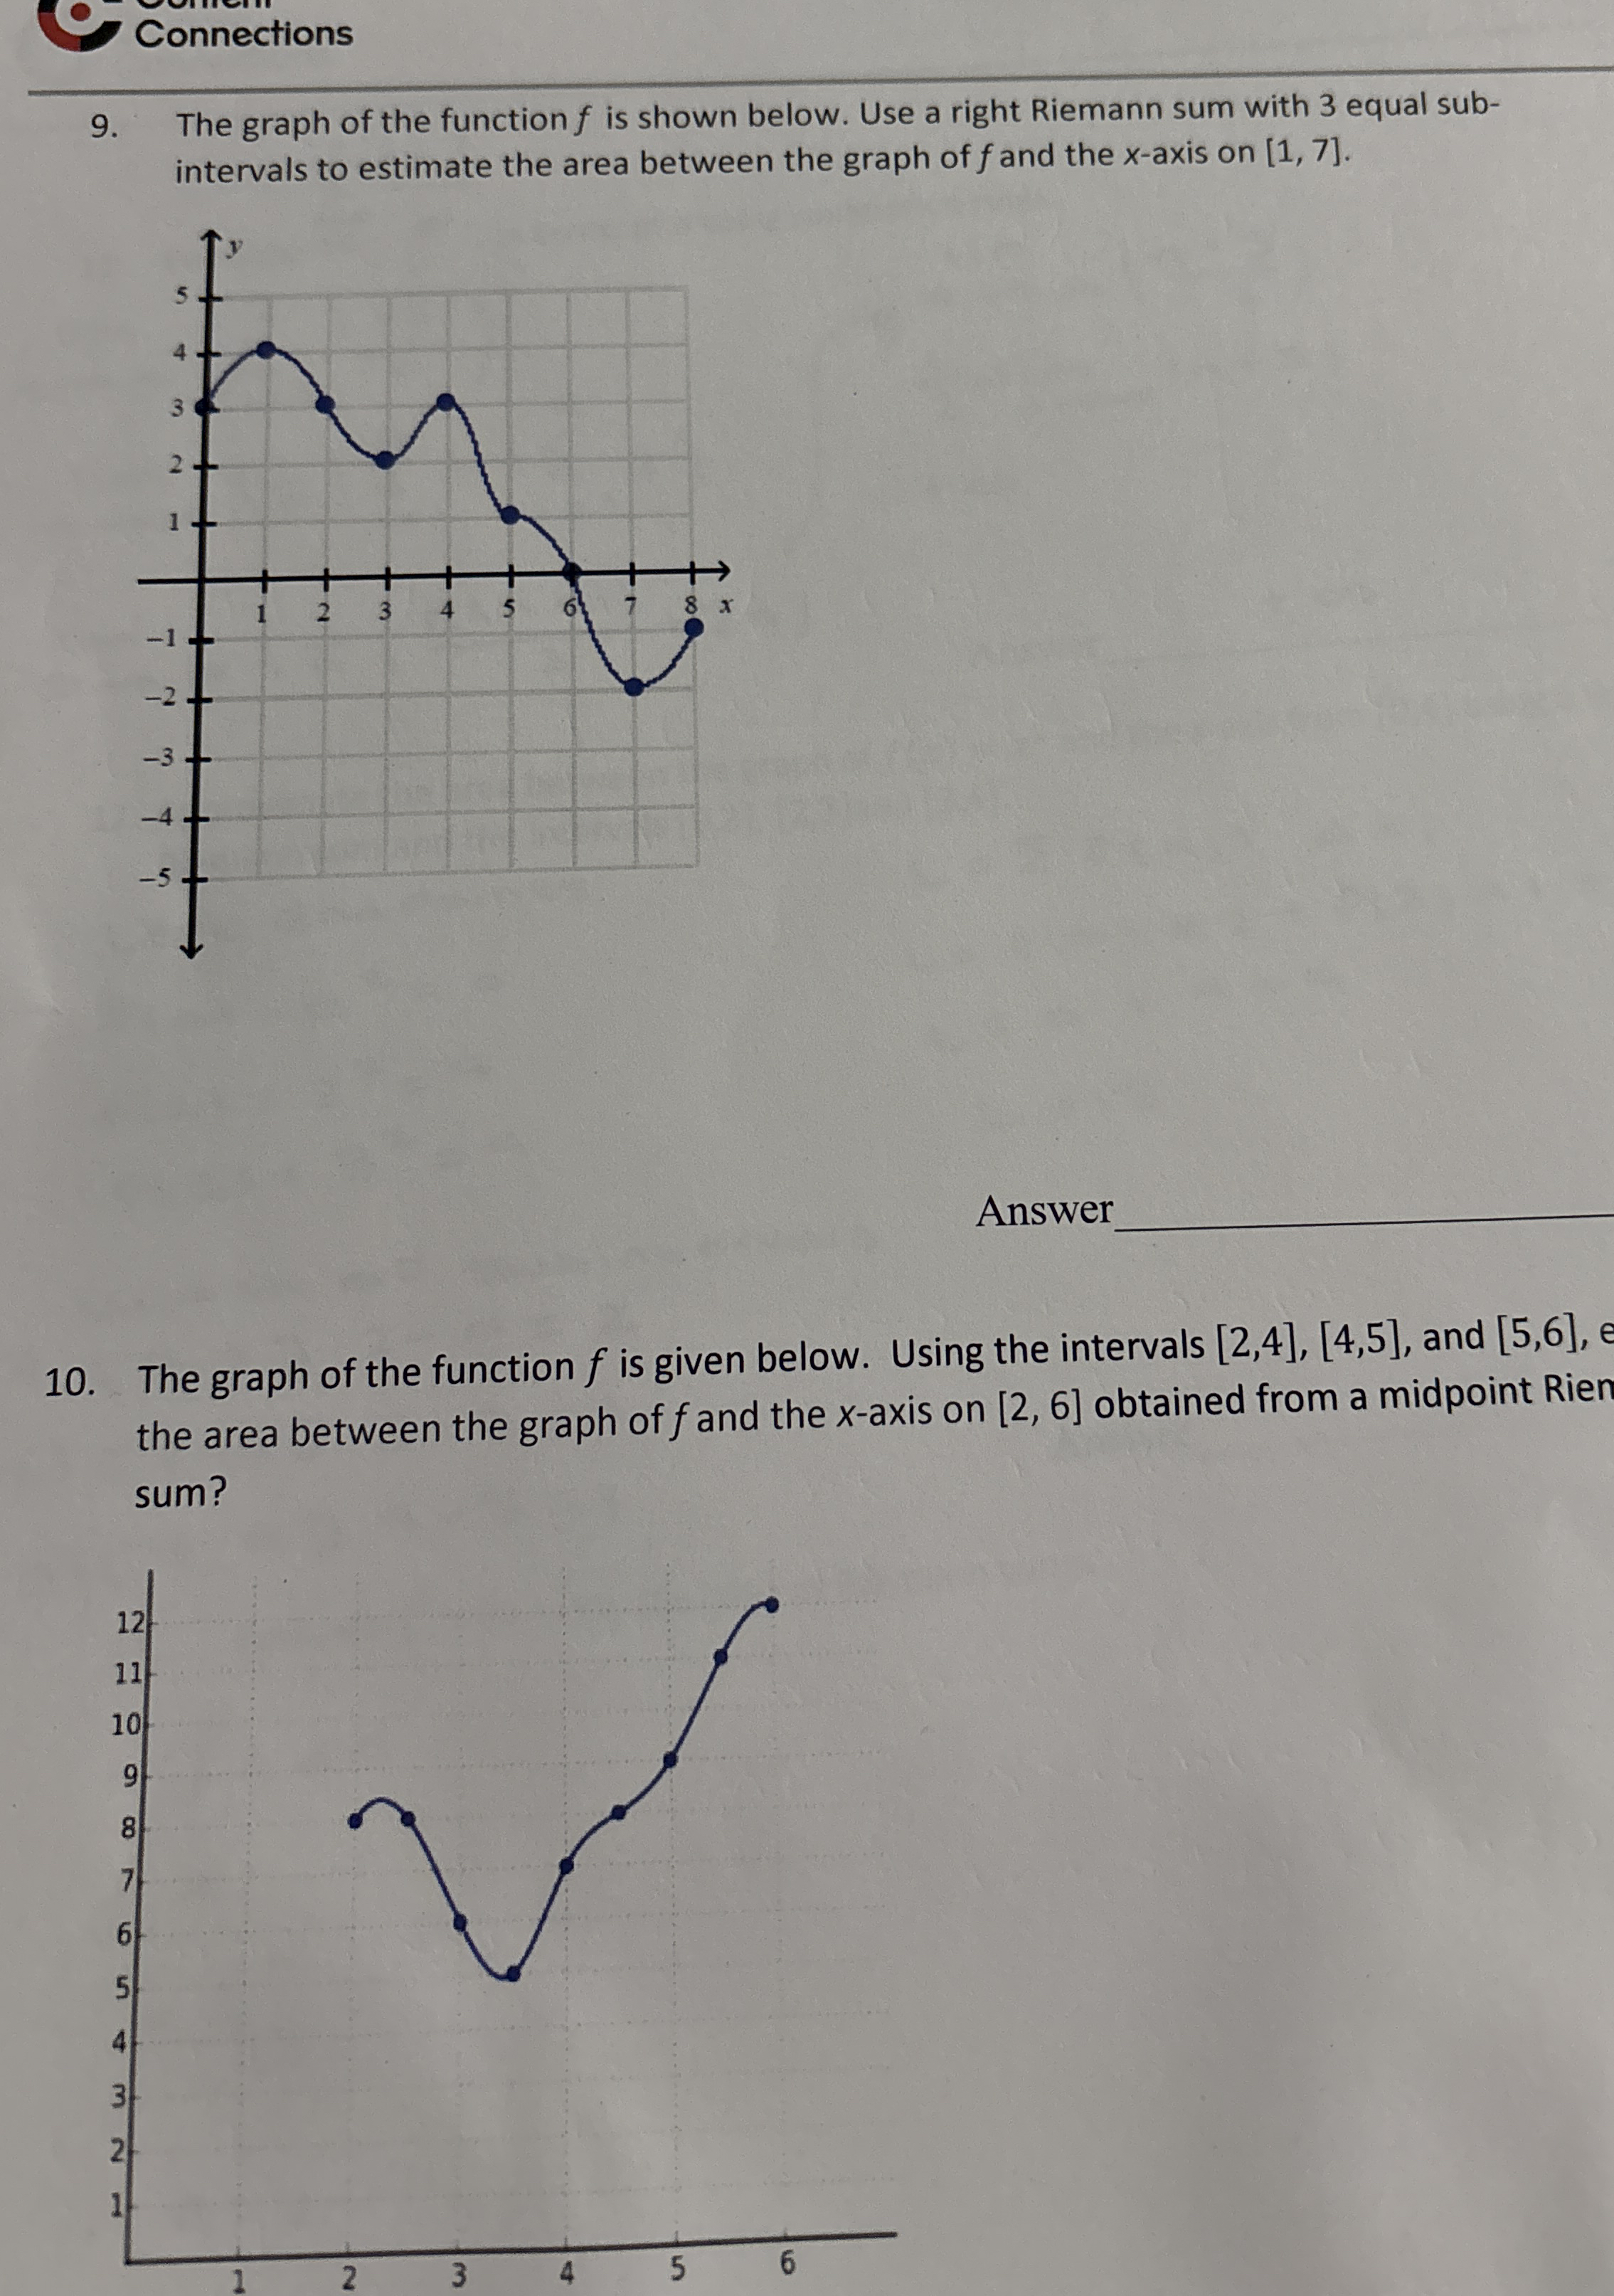
The graph of the function is shown below. Use a right Riemann sum with equal subintervals to estimate the area between the graph of and the axis on
Answer
The graph of the function is given below. Using the intervals
and the area between the graph of and the axis on obtained from a midpoint Rien sum?
Step by Step Solution
There are 3 Steps involved in it
1 Expert Approved Answer
Step: 1 Unlock

Question Has Been Solved by an Expert!
Get step-by-step solutions from verified subject matter experts
Step: 2 Unlock
Step: 3 Unlock