

Question: Consensus Expected return: Month end prices: 1. Calculation of stock specific parameters (25 marks) The return of the stock is given by: Rki and RMi
Consensus Expected return:
Month end prices:
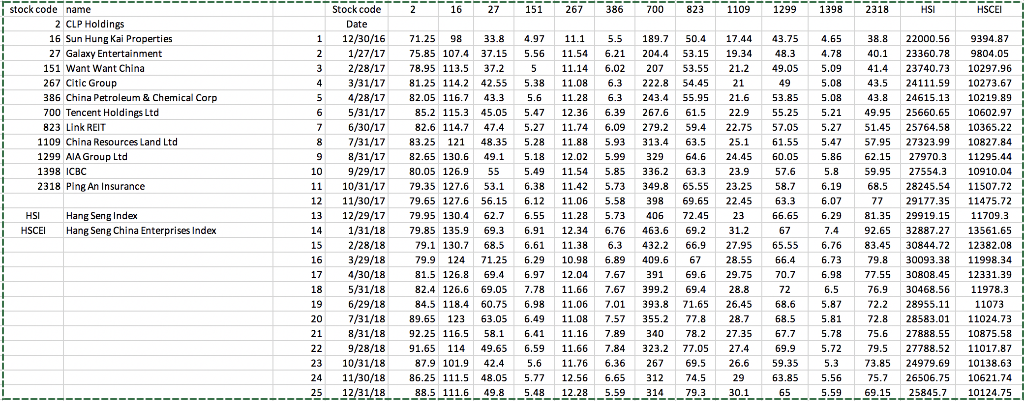
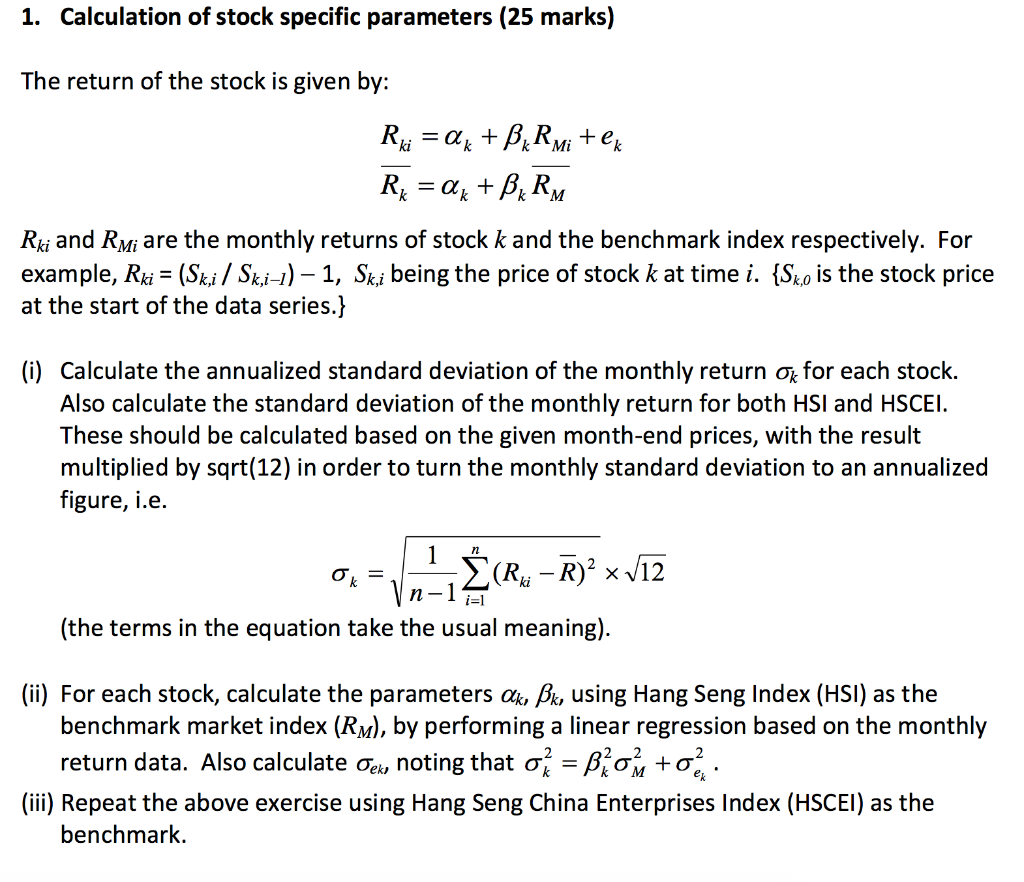
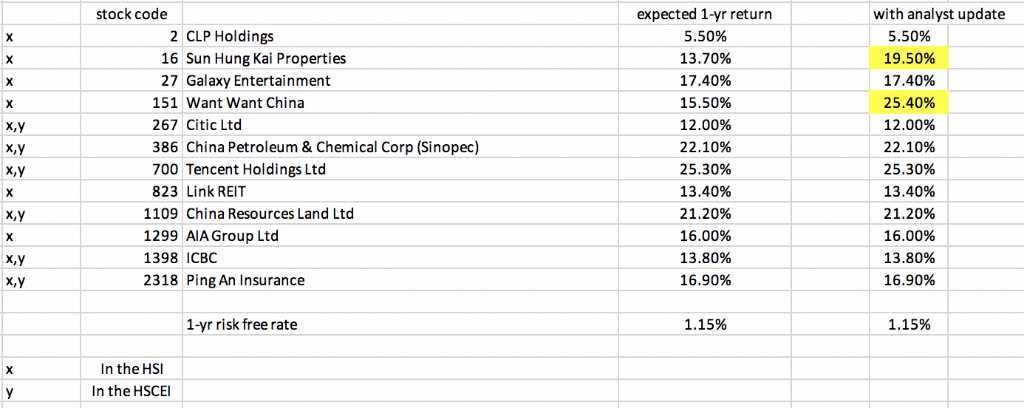
1. Calculation of stock specific parameters (25 marks) The return of the stock is given by: Rki and RMi are the monthly returns of stock k and the benchmark index respectively. For example, Rki = (Ski/ Sk,i-)-1. k,i being the price of stock k at time i. {Sk,0 is the stock price at the start of the data series. (i) Calculate the annualized standard deviation of the monthly return k for each stock. Also calculate the standard deviation of the monthly return for both HSI and HSCEI These should be calculated based on the given month-end prices, with the result multiplied by sqrt(12) in order to turn the monthly standard deviation to an annualized figure, i.e. ! (the terms in the equation take the usual meaning) (ii) For each stock, calculate the parameters a*, Pk, using Hang Seng Index (HSI) as the benchmark market index (RM), by performing a linear regression based on the monthly return data. Also calculate oe, noting that -AO, t (ii) Repeat the above exercise using Hang Seng China Enterprises Index (HSCEI) as the benchmark. stock code expected 1-yr return 5.50% 13.70% 17.40% 15.50% 12.00% 22.10% 25.30% 13.40% 21.20% 16.00% 13.80% 16.90% with analyst update 5.50% 19.50% 17.40% 25.40% 12.00% 22.10% 25.30% 13.40% 21.20% 16.00% 13.80% 16.90% 2 CLP Holdings 16 Sun Hung Kai Properties 27 Galaxy Entertainment 151 Want Want China 267 Citic Ltd 386 China Petroleum & Chemical Corp (Sinopec) 700 Tencent Holdings Ltd 823 Link REIT 1109 China Resources Land Ltd 1299 AIA Group Ltd 1398 ICBC 2318 Ping An Insurance 1-yr risk free rate 1.15% 1.15% In the HSI In the HSCEI stock code name Stock code Date 2 16 27 151 267 386 700 823 1109 1299 1398 2318 HSI HSCEI 2 CLP Holdings 112/30/16 71.25 98 33.8 4.97 11.1 5.5 189.7 50.4 17.44 43.75 4.65 38.8 22000.56 9394.87 2 1/27/17 75.85 107.4 37.15 5.56 11.54 6.2 204.4 53.15 19.34 48.3 4.78 40.1 23360.78 9804.05 3 2/28/17 78.95 113.5 37.2 5 11.14 6.02 207 53.55 21.2 49.05 5.09 41.4 23740.73 10297.96 16 Sun Hung Kai Properties 27 Galaxy Entertainment 151 Want Want China 267 Citic Group 386 China Petroleum & Chemical Corp 700 Tencent Holdings Ltd 823 Link REIT 43/31/17 81.25 114.2 42.55 5.38 11.08 6.3 222.8 54.45 21 5 4/28/1782.05 116.7 43.3 5.6 11.28 6.3 243.4 55.95 216 53.85 5.08 43.8 24615.13 10219.89 6 5/31/17 8 115.3 45.05 5.47 12.36 6.39 267.6 61.5 22.9 55.25 5.21 49.95 25660.65 10602.97 82.6 114.7 47.4 5.27 11.74 6.09 279.2 59.4 22.75 57.05 5.2751.4525764.58 10365.22 8 7/31/17 83.25 121 48.35 5.28 11.88 5.93 313.4 63.525.1 61.55 5.47 57.95 27323.99 10827.84 9 8/31/17 82.65 130.6 49.15.18 12.025.99 329 64.6 24.45 60.05 5.86 62.15 27970.311295.44 10 9/29/1780.05 126.9 55 5.49 11.54 5.85 336.2 63.3 23.957.5.8 59.95 27554.3 10910.04 53.1 6.38 11.42 5.73 349.8 65.55 23.25 58.7 6.1968.5 28245.54 11507.72 12 11/30/1779.65 127.6 56.15 6.12 11.06 5.58 398 69.65 22.45 63.3 6.07 77 29177.3511475.72 13 12/29/1779.95 130.4 62.7 6.55 11.28 5.73 406 2.4523 66.65 6.2981.35 29919.15 11709.3 92.65 32887.27 13561.65 83.45 30844.72 12382.08 16 3/29/1879.9 124 71.25 6.29 10.98 6.89 409.6 67 28.55 66.4 6.73 79.8 30093.38 11998.34 17 4/30/1881.5 126.8 69.4 6.97 12.04 7.67 39169.6 29.75.76.98 77.55 30808.45 12331.39 76.9 30468.56 11978.3 7 6/30/17 1109 China Resources Land Ltd 1299 AIA Group Ltd 1398 ICBC 2318 Ping An Insurance 1110/31/17 79.35 127.6 HSI HSCEI Hang Seng China Enterprises Index 14 1/31/1879.85 135.9 69.3 6.91 12.34 6.76 463.66. 31.67 7.4 79.1 130.7 68.5 6.61 11.38 6.3432.2 66.9 27.95 65.55 6.76 18 5/31/18 82.4 126.6 69.05 7.78 11.66 7.67 399.2 69.4 28.8 72 19 6/29/18 6.5 5.87 84.5 118.4 60.75 6.98 11.06 7.0393.8 71.65 26.45 68.6 72.2 28955.11 11073 20 7/31/18 89.65 123 63.05 6.49 11.08 7.57 355.2 77.8 28.7 68.5 5.81 72.8 28583.01 11024.73 21 8/31/1892.25 116.5 58.1 6.41 11.16 7.89 34078.2 27.35 7.75.7875.6 27888.55 10875.58 22 9/28/18 91.65 114 49.65 6.5911.66 7.84 323.2 77.05 27.4 69.9572 79.5 27788.52 11017.87 23 10/31/18 87.9 101.9 42.4 5.6 11.76 6.36 267 69.5 26.6 59.35 5.3 73.85 24979.69 10138.63 24 11/30/18 86.25 111.5 48.05 5.77 12.56 6.65 312 74.5 2963.85 5.567 26506.75 10621.74 25_12/31/1888.5 111.649.8 _5.4812.28 _5.59314_79.3_30.1_65__5.59_69.15_L25845.710124.75 1. Calculation of stock specific parameters (25 marks) The return of the stock is given by: Rki and RMi are the monthly returns of stock k and the benchmark index respectively. For example, Rki = (Ski/ Sk,i-)-1. k,i being the price of stock k at time i. {Sk,0 is the stock price at the start of the data series. (i) Calculate the annualized standard deviation of the monthly return k for each stock. Also calculate the standard deviation of the monthly return for both HSI and HSCEI These should be calculated based on the given month-end prices, with the result multiplied by sqrt(12) in order to turn the monthly standard deviation to an annualized figure, i.e. ! (the terms in the equation take the usual meaning) (ii) For each stock, calculate the parameters a*, Pk, using Hang Seng Index (HSI) as the benchmark market index (RM), by performing a linear regression based on the monthly return data. Also calculate oe, noting that -AO, t (ii) Repeat the above exercise using Hang Seng China Enterprises Index (HSCEI) as the benchmark. stock code expected 1-yr return 5.50% 13.70% 17.40% 15.50% 12.00% 22.10% 25.30% 13.40% 21.20% 16.00% 13.80% 16.90% with analyst update 5.50% 19.50% 17.40% 25.40% 12.00% 22.10% 25.30% 13.40% 21.20% 16.00% 13.80% 16.90% 2 CLP Holdings 16 Sun Hung Kai Properties 27 Galaxy Entertainment 151 Want Want China 267 Citic Ltd 386 China Petroleum & Chemical Corp (Sinopec) 700 Tencent Holdings Ltd 823 Link REIT 1109 China Resources Land Ltd 1299 AIA Group Ltd 1398 ICBC 2318 Ping An Insurance 1-yr risk free rate 1.15% 1.15% In the HSI In the HSCEI stock code name Stock code Date 2 16 27 151 267 386 700 823 1109 1299 1398 2318 HSI HSCEI 2 CLP Holdings 112/30/16 71.25 98 33.8 4.97 11.1 5.5 189.7 50.4 17.44 43.75 4.65 38.8 22000.56 9394.87 2 1/27/17 75.85 107.4 37.15 5.56 11.54 6.2 204.4 53.15 19.34 48.3 4.78 40.1 23360.78 9804.05 3 2/28/17 78.95 113.5 37.2 5 11.14 6.02 207 53.55 21.2 49.05 5.09 41.4 23740.73 10297.96 16 Sun Hung Kai Properties 27 Galaxy Entertainment 151 Want Want China 267 Citic Group 386 China Petroleum & Chemical Corp 700 Tencent Holdings Ltd 823 Link REIT 43/31/17 81.25 114.2 42.55 5.38 11.08 6.3 222.8 54.45 21 5 4/28/1782.05 116.7 43.3 5.6 11.28 6.3 243.4 55.95 216 53.85 5.08 43.8 24615.13 10219.89 6 5/31/17 8 115.3 45.05 5.47 12.36 6.39 267.6 61.5 22.9 55.25 5.21 49.95 25660.65 10602.97 82.6 114.7 47.4 5.27 11.74 6.09 279.2 59.4 22.75 57.05 5.2751.4525764.58 10365.22 8 7/31/17 83.25 121 48.35 5.28 11.88 5.93 313.4 63.525.1 61.55 5.47 57.95 27323.99 10827.84 9 8/31/17 82.65 130.6 49.15.18 12.025.99 329 64.6 24.45 60.05 5.86 62.15 27970.311295.44 10 9/29/1780.05 126.9 55 5.49 11.54 5.85 336.2 63.3 23.957.5.8 59.95 27554.3 10910.04 53.1 6.38 11.42 5.73 349.8 65.55 23.25 58.7 6.1968.5 28245.54 11507.72 12 11/30/1779.65 127.6 56.15 6.12 11.06 5.58 398 69.65 22.45 63.3 6.07 77 29177.3511475.72 13 12/29/1779.95 130.4 62.7 6.55 11.28 5.73 406 2.4523 66.65 6.2981.35 29919.15 11709.3 92.65 32887.27 13561.65 83.45 30844.72 12382.08 16 3/29/1879.9 124 71.25 6.29 10.98 6.89 409.6 67 28.55 66.4 6.73 79.8 30093.38 11998.34 17 4/30/1881.5 126.8 69.4 6.97 12.04 7.67 39169.6 29.75.76.98 77.55 30808.45 12331.39 76.9 30468.56 11978.3 7 6/30/17 1109 China Resources Land Ltd 1299 AIA Group Ltd 1398 ICBC 2318 Ping An Insurance 1110/31/17 79.35 127.6 HSI HSCEI Hang Seng China Enterprises Index 14 1/31/1879.85 135.9 69.3 6.91 12.34 6.76 463.66. 31.67 7.4 79.1 130.7 68.5 6.61 11.38 6.3432.2 66.9 27.95 65.55 6.76 18 5/31/18 82.4 126.6 69.05 7.78 11.66 7.67 399.2 69.4 28.8 72 19 6/29/18 6.5 5.87 84.5 118.4 60.75 6.98 11.06 7.0393.8 71.65 26.45 68.6 72.2 28955.11 11073 20 7/31/18 89.65 123 63.05 6.49 11.08 7.57 355.2 77.8 28.7 68.5 5.81 72.8 28583.01 11024.73 21 8/31/1892.25 116.5 58.1 6.41 11.16 7.89 34078.2 27.35 7.75.7875.6 27888.55 10875.58 22 9/28/18 91.65 114 49.65 6.5911.66 7.84 323.2 77.05 27.4 69.9572 79.5 27788.52 11017.87 23 10/31/18 87.9 101.9 42.4 5.6 11.76 6.36 267 69.5 26.6 59.35 5.3 73.85 24979.69 10138.63 24 11/30/18 86.25 111.5 48.05 5.77 12.56 6.65 312 74.5 2963.85 5.567 26506.75 10621.74 25_12/31/1888.5 111.649.8 _5.4812.28 _5.59314_79.3_30.1_65__5.59_69.15_L25845.710124.75
Step by Step Solution
There are 3 Steps involved in it

Get step-by-step solutions from verified subject matter experts