

Question: Consider a binomial experiment with two trials and p = .4. Which of the following tree diagrams accurately represents this binomial experiment? Select Tree diagram
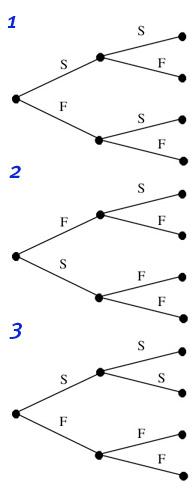
Consider a binomial experiment with two trials andp= .4.
- Which of the following tree diagrams accurately represents this binomial experiment?
- Compute the probability of one success,f(1) (to 2 decimals).
- Computef(0) (to 2 decimals).
- Computef(2) (to 2 decimals).
- Compute the probability of at least one success (to 2 decimals).
- Compute the following (to 2 decimals).
Expected value Variance Standard deviation
1 F 3 F %24 2.
Step by Step Solution
★★★★★
3.40 Rating (144 Votes )
There are 3 Steps involved in it
1 Expert Approved Answer
Step: 1 Unlock

I diagram I accurately represents 2 P of I success ... View full answer
Question Has Been Solved by an Expert!
Get step-by-step solutions from verified subject matter experts
Step: 2 Unlock
Step: 3 Unlock