

Question: Consider a Poisson probability distribution with = 5.9. Determine the following probabilities. a) exactly 5 occurrences b) more than 6 occurrences c) 3 or

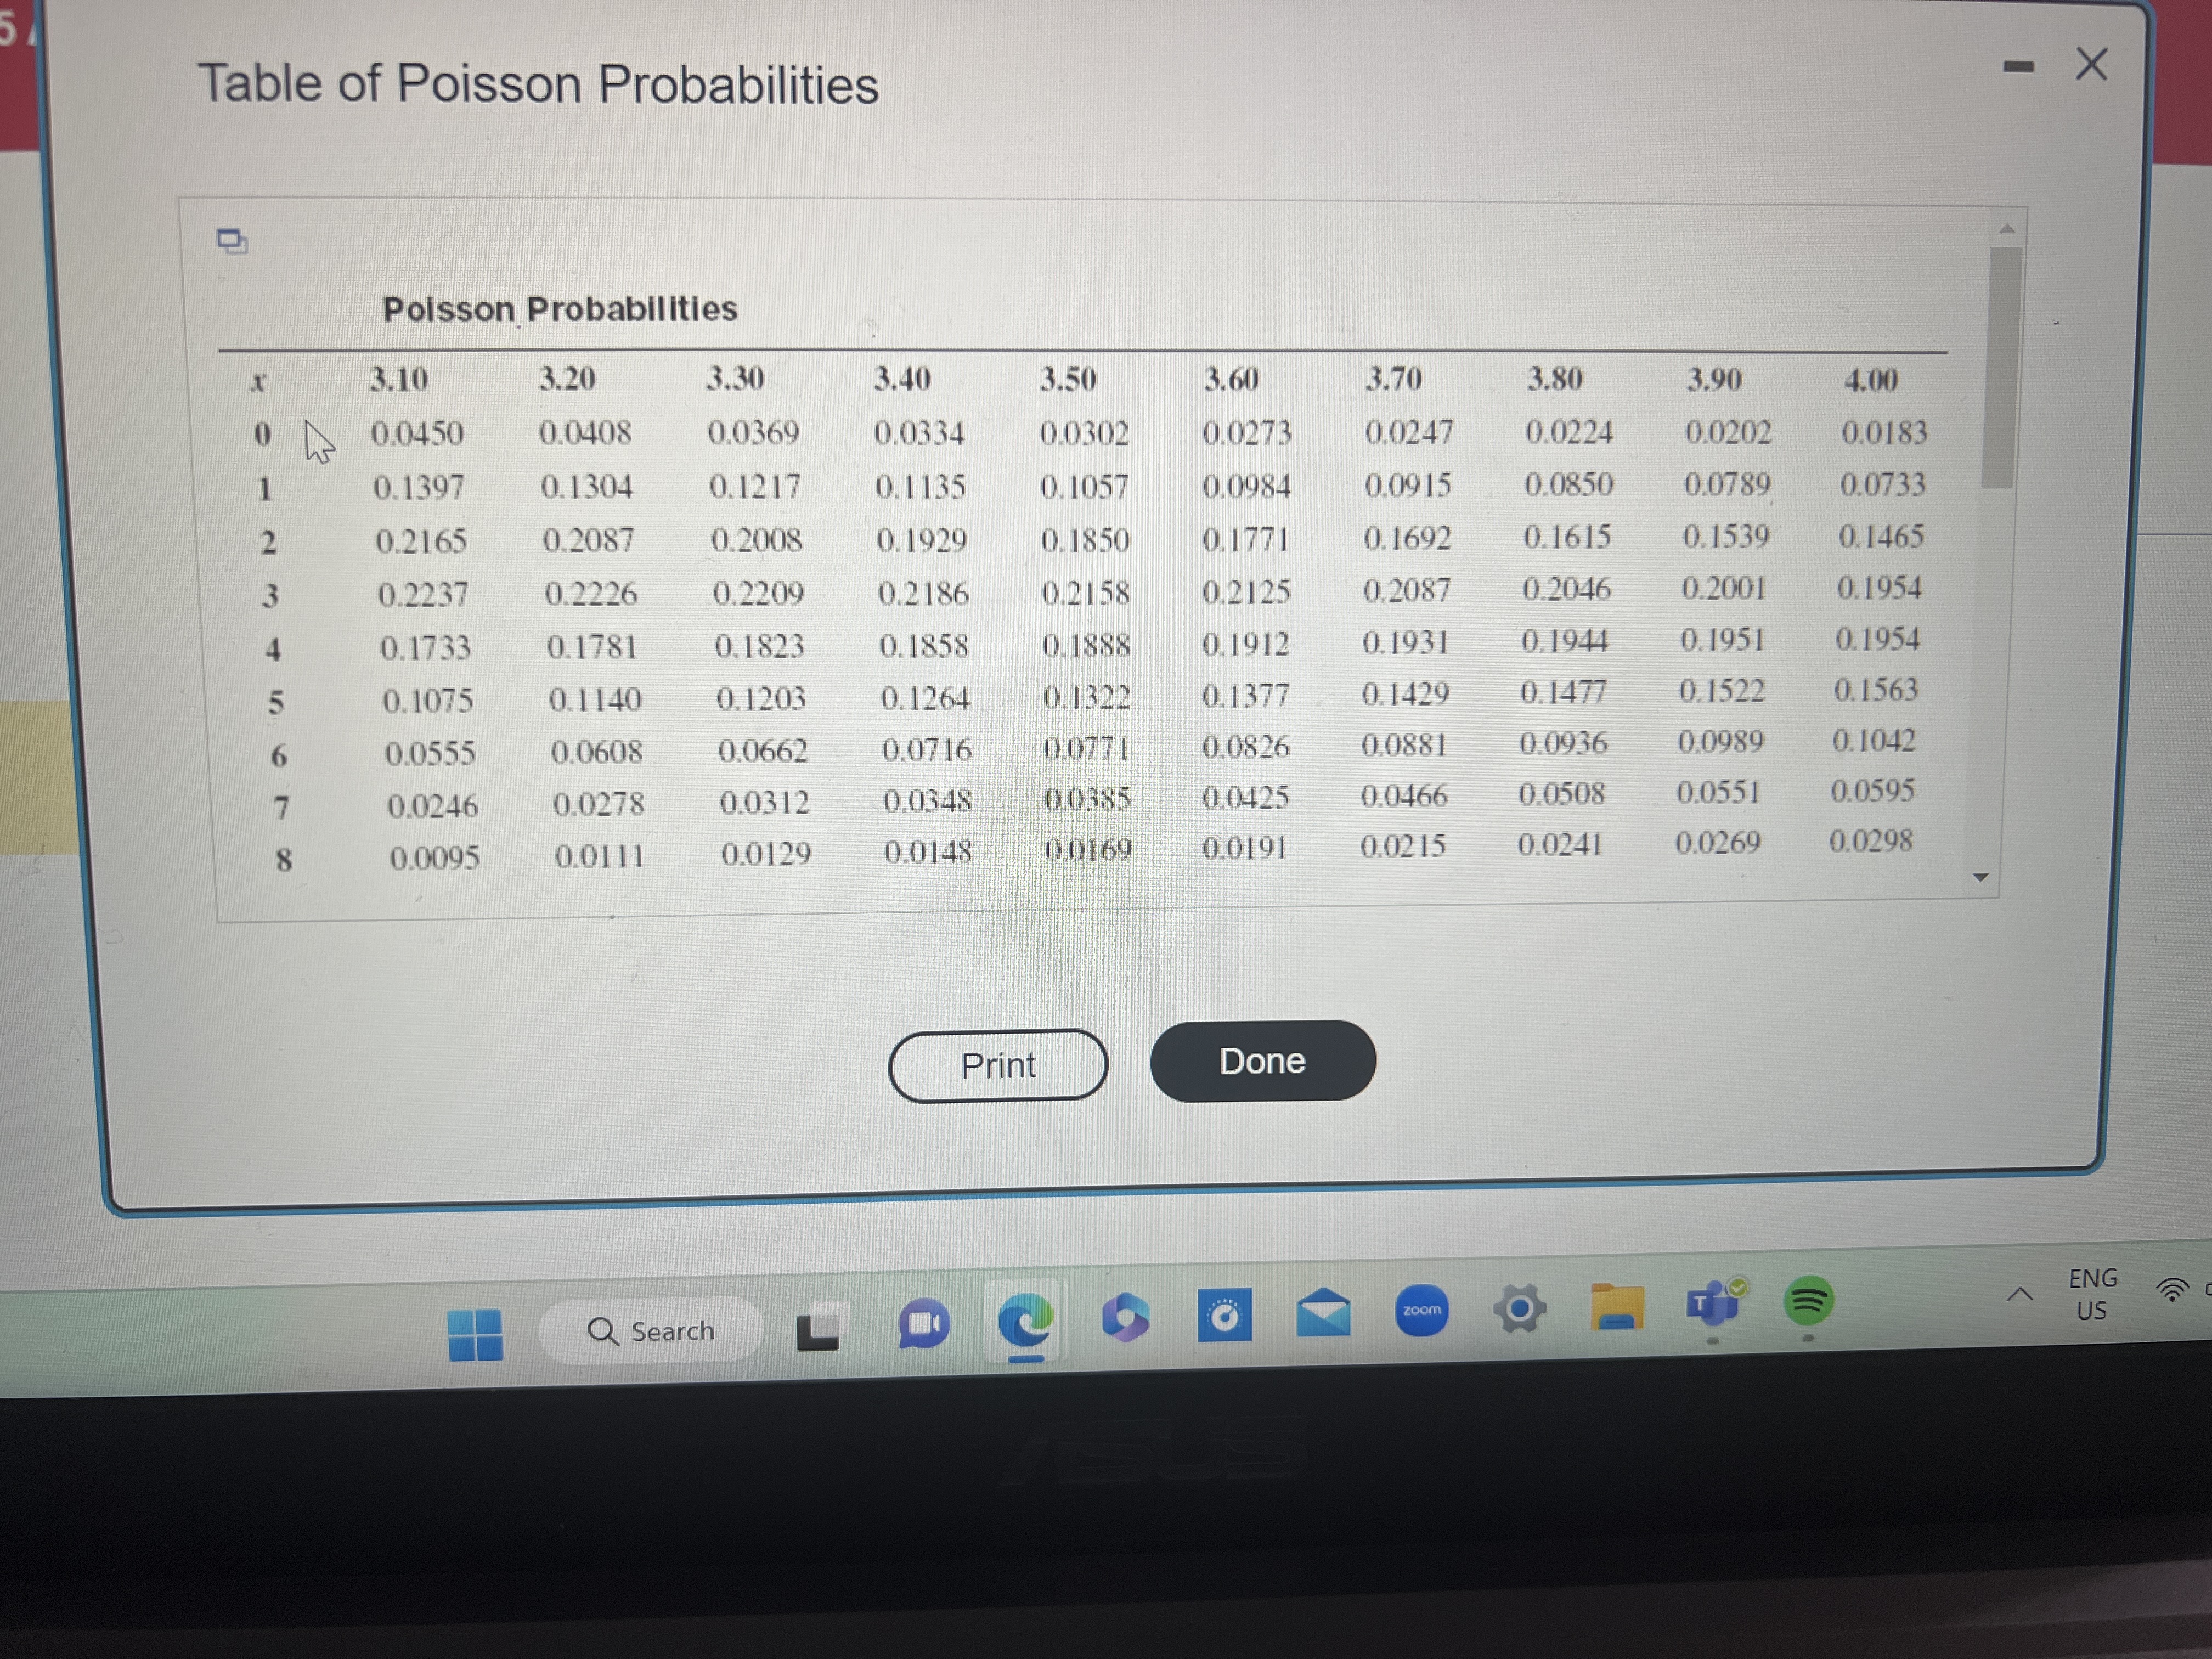
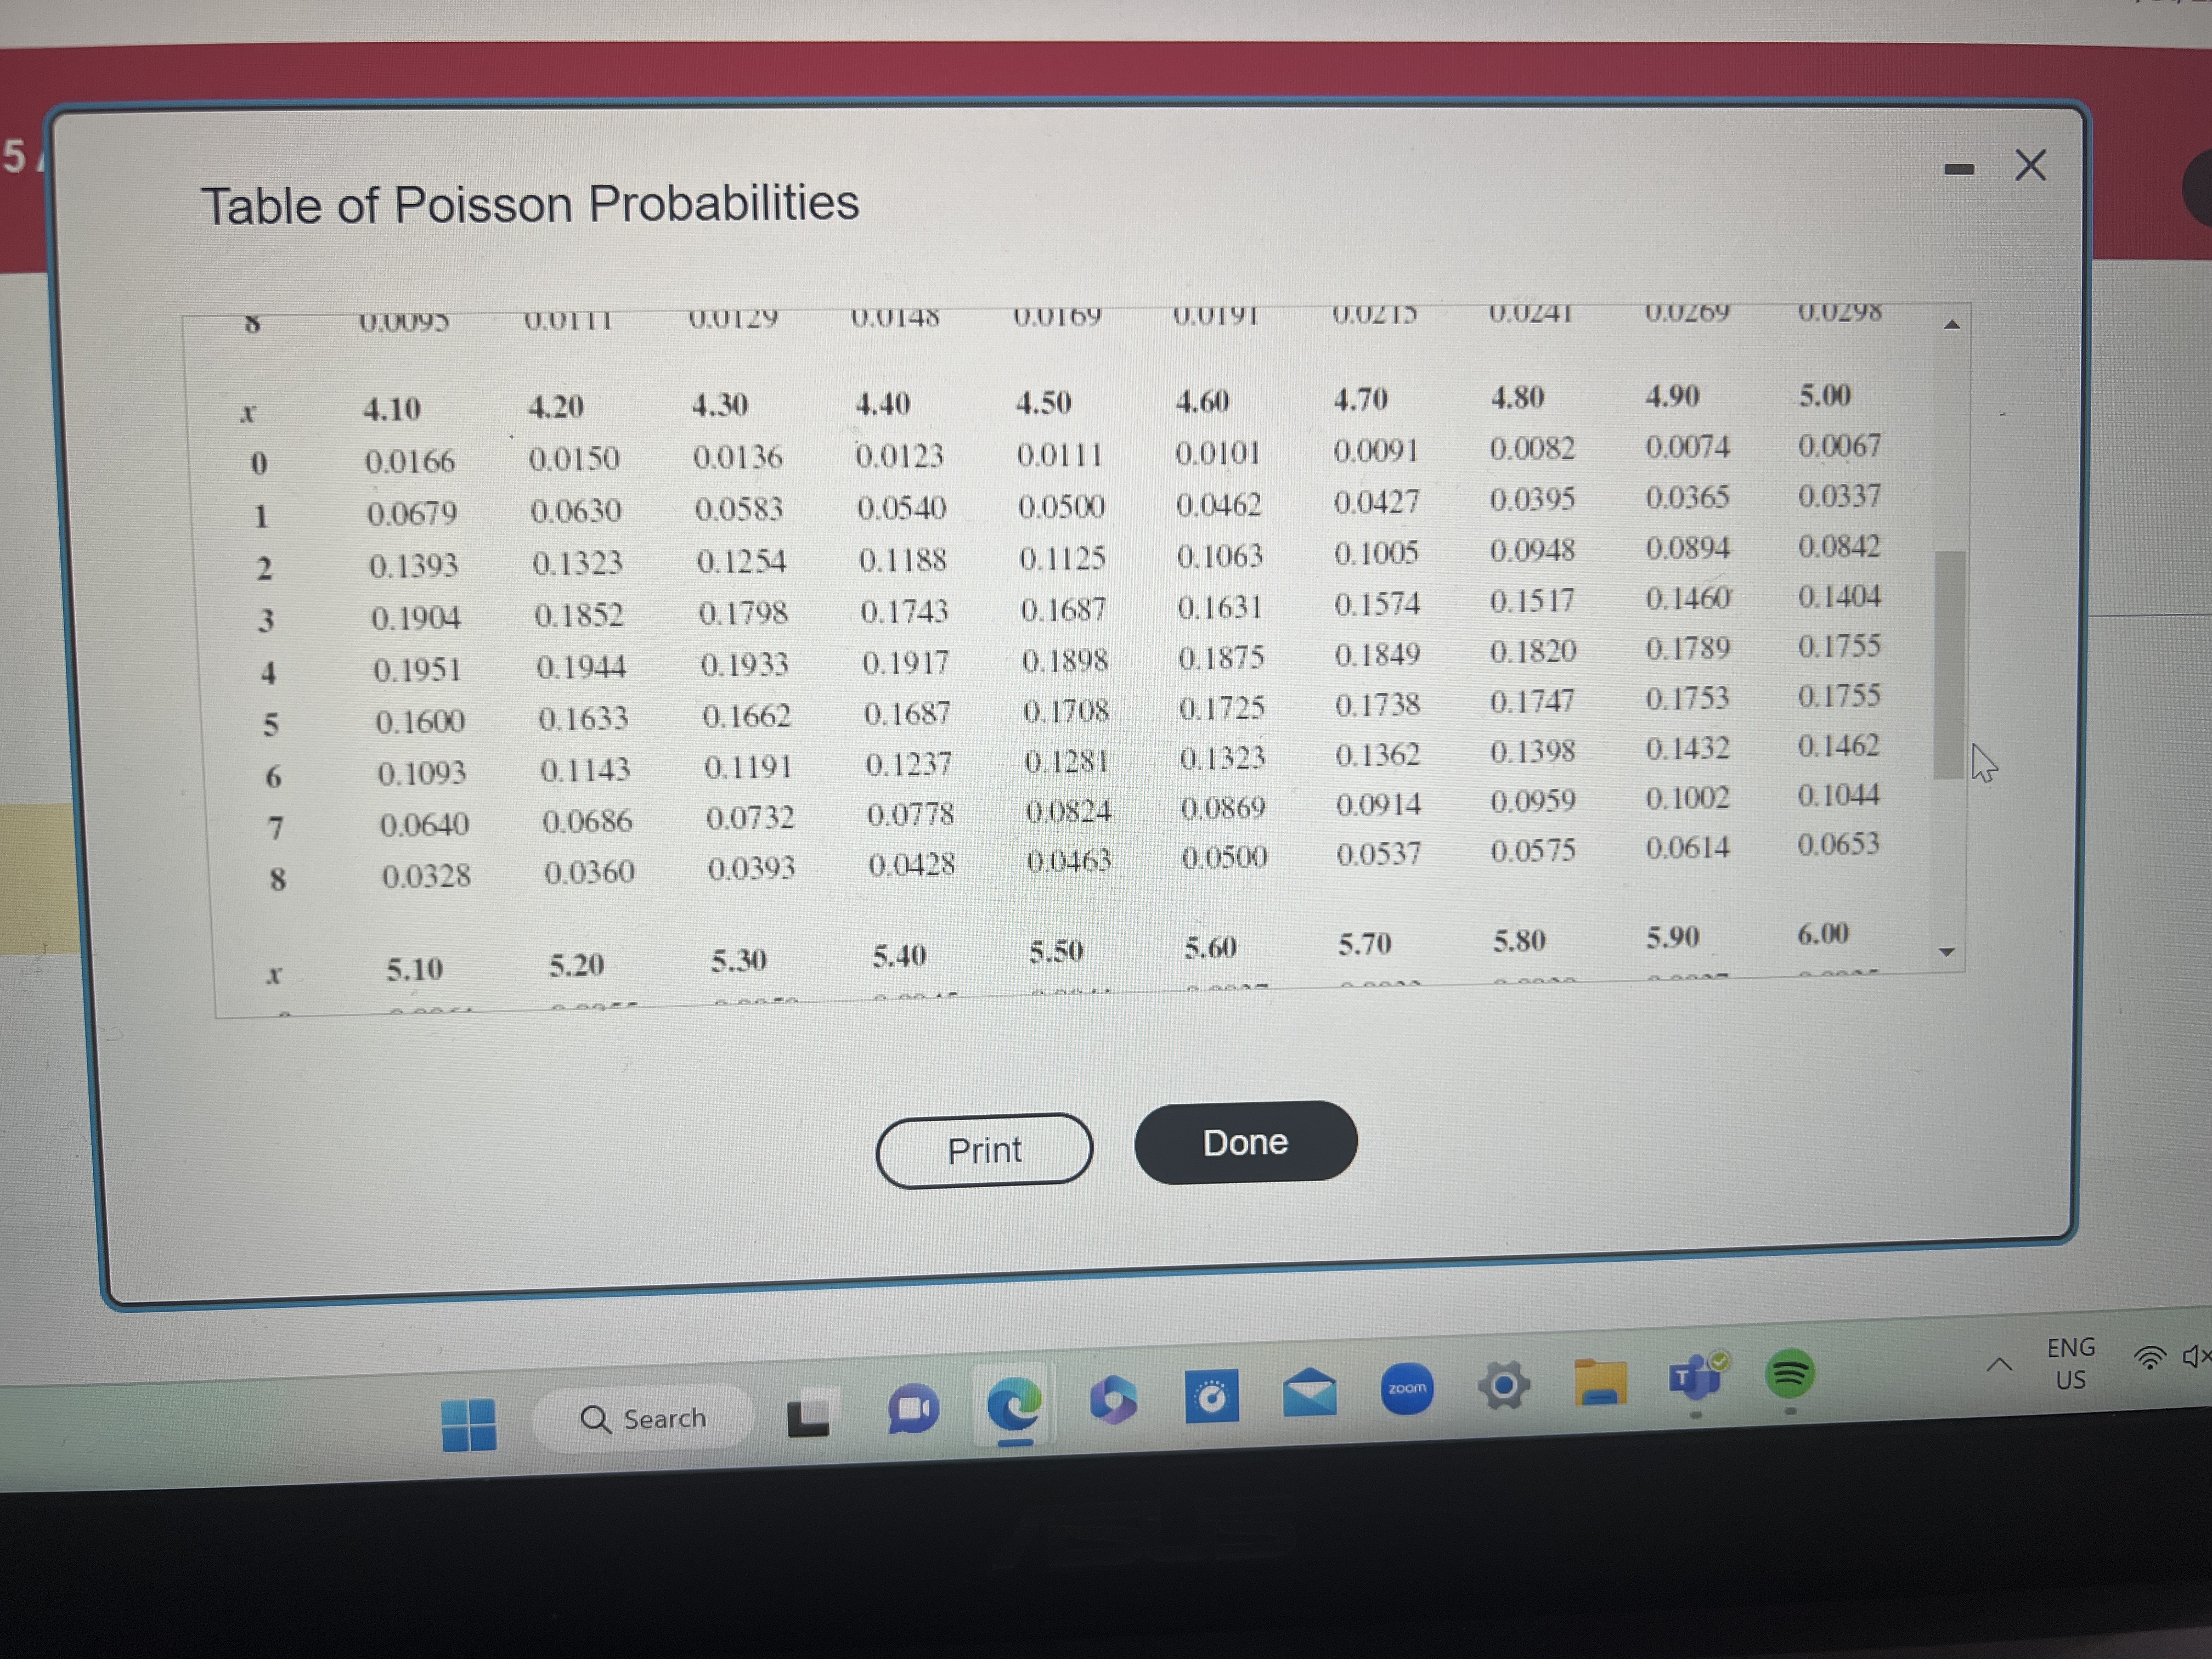
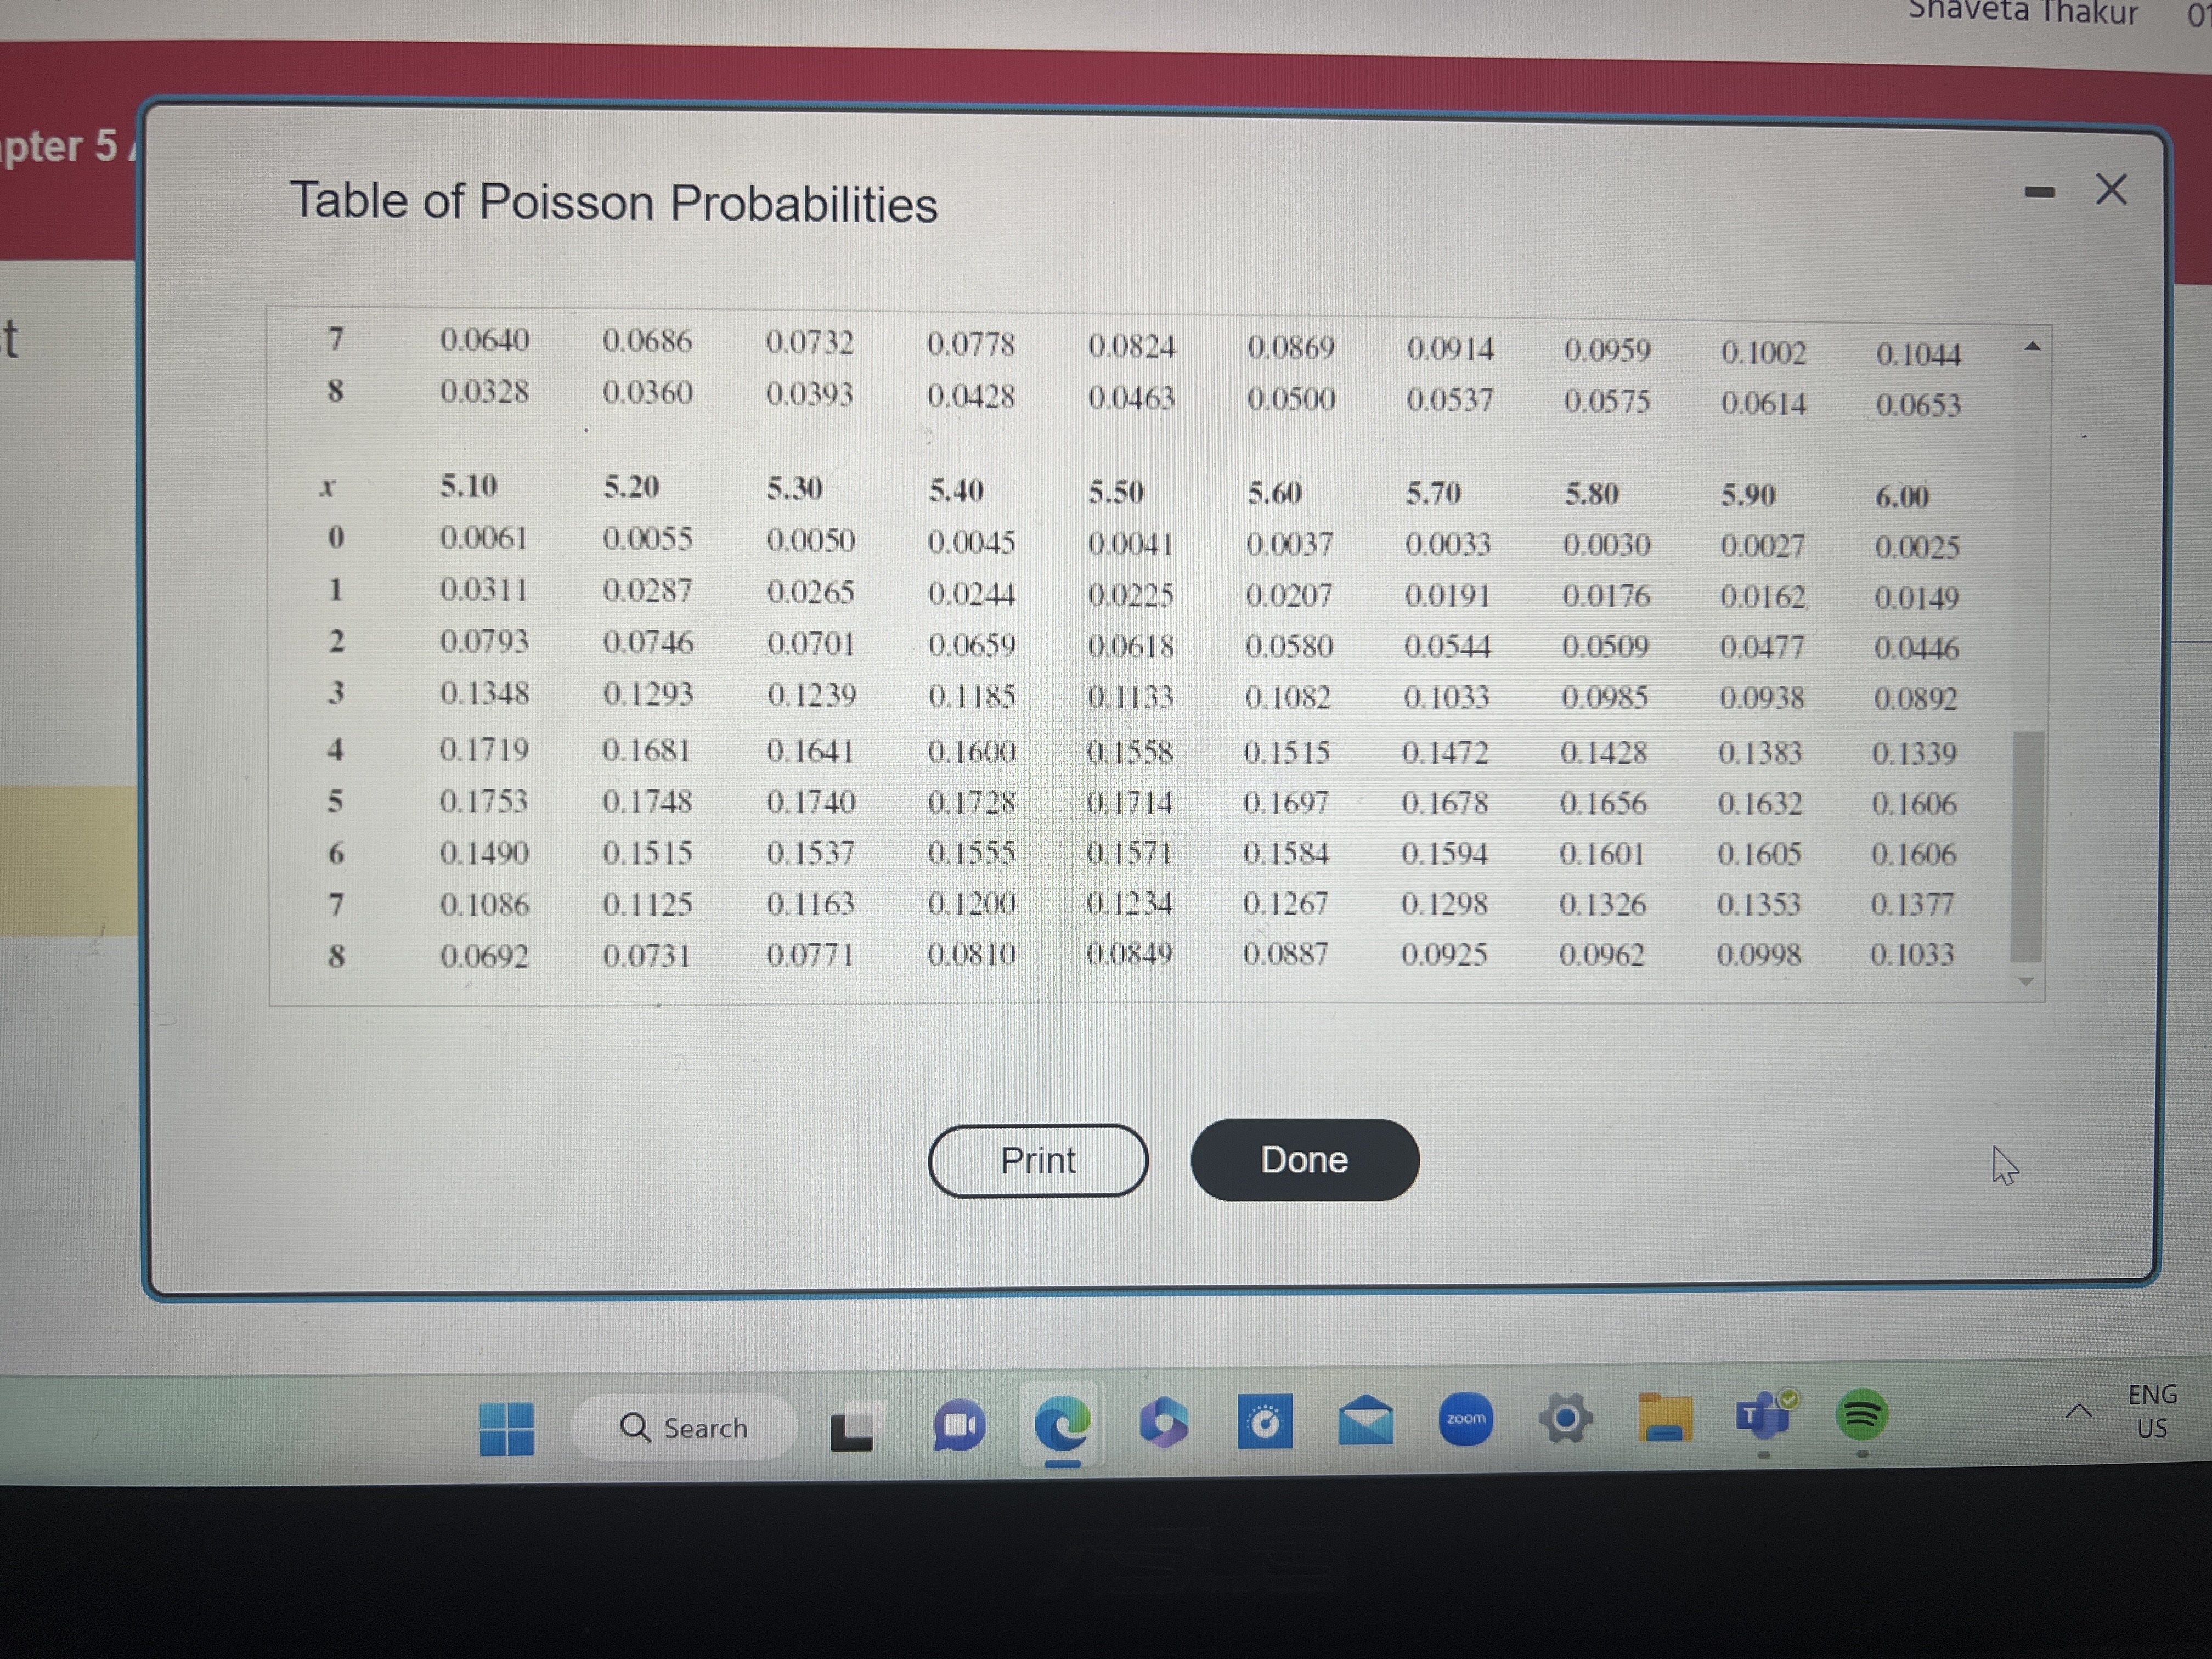
Consider a Poisson probability distribution with = 5.9. Determine the following probabilities. a) exactly 5 occurrences b) more than 6 occurrences c) 3 or fewer occurrences Click the icon to view a partial table of Poisson probabilities. a) The probability of exactly 5 occurrences is (Round to four decimal places as needed.) b) The probability of more than 6 occurrences is (Round to four decimal places as needed.) c) The probability of 3 or fewer occurrences is (Round to four decimal places as needed.) 13 14 Q Search LO zoom 4. 15 % 5 16 1 f7 6 ? 3 A E D f80/ & 7 19 * 8 2 f10 9 12/A R T Y U F LL 5. Table of Poisson Probabilities Poisson Probabilities - X I 3.10 3.20 3.30 3.40 3.50 3.60 3.70 3.80 3.90 4.00 0.0450 0.0408 0.0369 0.0334 0.0302 0.0273 0.0247 0.0224 0.0202 0.0183 1 0.1397 0.1304 0.1217 0.1135 0.1057 0.0984 0.0915 0.0850 0.0789 0.0733 2 0.2165 0.2087 0.2008 0.1929 0.1850 0.1771 0.1692 0.1615 0.1539 0.1465 3 0.2237 0.2226 0.2209 0.2186 0.2158 0.2125 0.2087 0.2046 0.2001 0.1954 0.1733 0.1781 0.1823 0.1858 0.1888 0.1912 0.1931 0.1944 0.1951 0.1954 0.1075 0.1140 0.1203 0.1264 0.1322 0.1377 0.1429 0.1477 0.1522 0.1563 0.0555 0.0608 0.0662 0.0716 0.0771 0.0826 0.0881 0.0936 0.0989 0.1042 7 0.0246 0.0278 0.0312 0.0348 0.0385 0.0425 0.0466 0.0508 0.0551 0.0595 8 0.0095 0.0111 0.0129 0.0148 0.0169 0.0191 0.0215 0.0241 0.0269 0.0298 Q Search Print Done ENG A T zoom US 51 Table of Poisson Probabilities 8 0.0095 0.0111 0.0129 0.0148 0.0169 0.0191 0.0213 0.0241 0.0269 0.0298 I 4.10 4.20 4.30 4.40 4.50 4.60 4.70 4.80 4.90 5.00 0 0.0166 0.0150 0.0136 0.0123 0.0111 0.0101 0.0091 0.0082 0.0074 0.0067 1 0.0679 0.0630 0.0583 0.0540 0.0500 0.0462 0.0427 0.0395 0.0365 0.0337 2 0.1393 0.1323 0.1254 0.1188 0.1125 0.1063 0.1005 0.0948 0.0894 0.0842 3 0.1904 0.1852 0.1798 0.1743 0.1687 0.1631 0.1574 0.1517 0.1460 0.1404 4 0.1951 0.1944 0.1933 0.1917 0.1898 0.1875 0.1849 0.1820 0.1789 0.1755 5 0.1600 0.1633 0.1662 0.1687 0.1708 0.1725 0.1738 0.1747 0.1753 0.1755 678 0.1093 0.1143 0.1191 0.1237 0.1281 0.1323 0.1362 0.1398 0.1432 0.1462 0.0640 0.0686 0.0732 0.0778 0.0824 0.0869 0.0914 0.0959 0.1002 0.1044 0.0328 0.0360 0.0393 0.0428 0.0463 0.0500 0.0537 0.0575 0.0614 0.0653 I 5.10 5.20 5.30 5.40 5.50 5.60 5.70 5.80 5.90 6.00 Q Search Print Done ENG zoom < x US pter 5 Table of Poisson Probabilities Shaveta Thakur 01 t 7 0.0640 0.0686 0.0732 0.0778 0.0824 0.0869 0.0914 0.0959 0.1002 0.1044 8 0.0328 0.0360 0.0393 0.0428 0.0463 0.0500 0.0537 0.0575 0.0614 0.0653 5.10 5.20 5.30 5.40 5.50 5.60 5.70 5.80 5.90 6.00 0 0.0061 0.0055 0.0050 0.0045 0.0041 0.0037 0.0033 0.0030 0.0027 0.0025 1 0.0311 0.0287 0.0265 0.0244 0.0225 0.0207 0.0191 0.0176 0.0162 0.0149 2 0.0793 0.0746 0.0701 0.0659 0.0618 0.0580 0.0544 0.0509 0.0477 0.0446 3 0.1348 0.1293 0.1239 0.1185 0.1133 0.1082 0.1033 0.0985 0.0938 0.0892 4 0.1719 0.1681 0.1641 0.1600 0.1558 0.1515 0.1472 0.1428 0.1383 0.1339 5 0.1753 0.1748 0.1740 0.1728 0.1714 0.1697 0.1678 0.1656 0.1632 0.1606 6 0.1490 0.1515 0.1537 0.1555 0.1571 0.1584 0.1594 0.1601 0.1605 0.1606 7 0.1086 0.1125 0.1163 0.1200 0.1234 0.1267 0.1298 0.1326 0.1353 0.1377 8 0.0692 0.0731 0.0771 0.0810 0.0849 0.0887 0.0925 0.0962 0.0998 0.1033 Q Search Print Done W zoom T A US ENG
Step by Step Solution
There are 3 Steps involved in it

Get step-by-step solutions from verified subject matter experts