

Question: Consider a portion of monthly return data (In %) on 20-year Treasury Bonds from 20062010. Estimate a linear trend model with seasonal dummy variables to
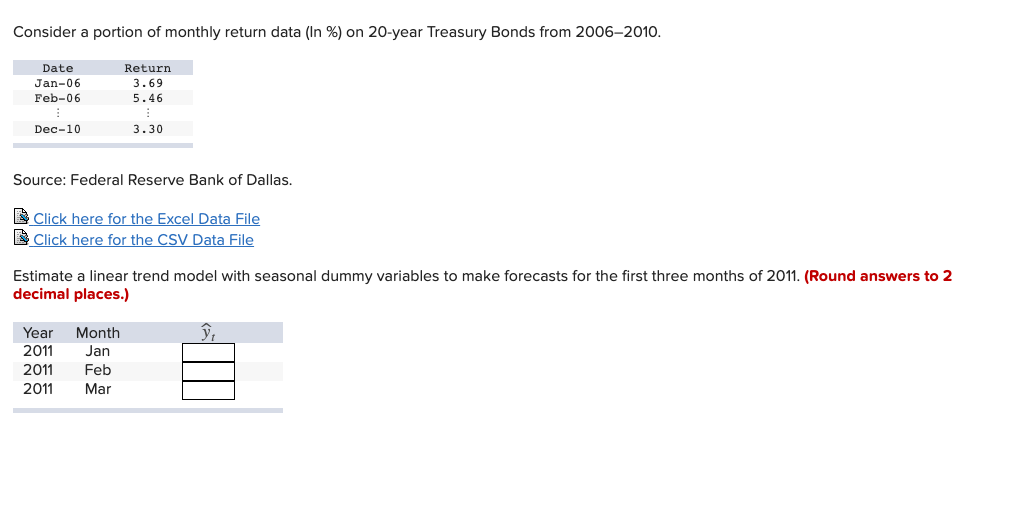
Consider a portion of monthly return data (In %) on 20-year Treasury Bonds from 20062010. Estimate a linear trend model with seasonal dummy variables to make forecasts for the first three months (JANUARY, FEB., & MARCH) of 2011. (Round answers to 2 decimal places.)
Data:
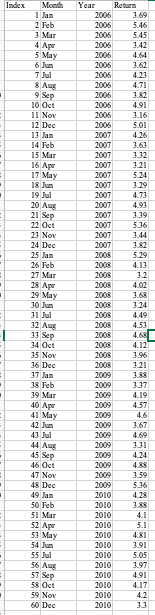
Consider a portion of monthly return data (in %) on 20-year Treasury Bonds from 2006-2010. Return Date Jan-06 Feb-06 3.69 5.46 Dec-10 3.30 Source: Federal Reserve Bank of Dallas. Click here for the Excel Data File Click here for the CSV Data File Estimate a linear trend model with seasonal dummy variables to make forecasts for the first three months of 2011. (Round answers to 2 decimal places.) Year 2011 2011 2011 Month Jan Feb Mar Index Month 1 Jan 2 Feb 3 Mar 4 Apr 5 May 6 Jun . 8 Aug 9 Sep 10 Oct 11 Nov 12 Dec 13 Jan 14 Feb 15 Mar 16 Apr 17 May 18 Jun 19 Jul 20 Aug 21 Sep 22 Oct 21 Nov 24 Dec 25 Jan 26 Feb 27 Mar 28 Apr 29 May 30 Jun 31 Jul . Year Return 2006 1.69 2006 5.46 2006 5.45 2006 3.42 2006 4.64 2006 3.62 2006 4.23 2006 4.71 2006 3.82 2006 4.91 2006 3.16 2006 5.01 2007 4.26 2007 2007 3.32 2007 3.21 2007 5.24 2007 3.29 2007 4.73 2007 4.93 2007 3.39 2007 5.36 2007 3.44 2007 3.82 2008 5.29 2008 4.13 2008 2008 4.02 2008 3.68 2008 3.24 2008 4.49 2008 4.53 2008 4.68 2008 4.12 2008 3.96 2008 3.21 2009 3.88 2009 3.37 2009 4.19 2009 4.57 2009 4.6 2009 3.67 2009 4.69 2009 3.31 2009 4.24 2009 2009 3.59 2009 5.36 2010 4.28 2010 3.88 2010 4.1 2010 5.1 2010 4.81 2010 3.91 2010 5.05 2010 3.97 2010 4.91 2010 4.17 2010 4.2 2010 3.3 12 Aug 13 Sep 34 Oct 35 Nov 36 Dec 37 Jan 38 Feb 39 Mar 40 Ape . 41 May 42 Jan 43 Jul 44 Aug 45 Sep 46 Oct 47 Nov 48 Dec 49 Jan 50 Feb 51 Mar 52 Apr 53 May 54 Jun 55 Jul 56 Aug 57 Sep 58 Oct 59 Nov 60 Dec - Consider a portion of monthly return data (in %) on 20-year Treasury Bonds from 2006-2010. Return Date Jan-06 Feb-06 3.69 5.46 Dec-10 3.30 Source: Federal Reserve Bank of Dallas. Click here for the Excel Data File Click here for the CSV Data File Estimate a linear trend model with seasonal dummy variables to make forecasts for the first three months of 2011. (Round answers to 2 decimal places.) Year 2011 2011 2011 Month Jan Feb Mar Index Month 1 Jan 2 Feb 3 Mar 4 Apr 5 May 6 Jun . 8 Aug 9 Sep 10 Oct 11 Nov 12 Dec 13 Jan 14 Feb 15 Mar 16 Apr 17 May 18 Jun 19 Jul 20 Aug 21 Sep 22 Oct 21 Nov 24 Dec 25 Jan 26 Feb 27 Mar 28 Apr 29 May 30 Jun 31 Jul . Year Return 2006 1.69 2006 5.46 2006 5.45 2006 3.42 2006 4.64 2006 3.62 2006 4.23 2006 4.71 2006 3.82 2006 4.91 2006 3.16 2006 5.01 2007 4.26 2007 2007 3.32 2007 3.21 2007 5.24 2007 3.29 2007 4.73 2007 4.93 2007 3.39 2007 5.36 2007 3.44 2007 3.82 2008 5.29 2008 4.13 2008 2008 4.02 2008 3.68 2008 3.24 2008 4.49 2008 4.53 2008 4.68 2008 4.12 2008 3.96 2008 3.21 2009 3.88 2009 3.37 2009 4.19 2009 4.57 2009 4.6 2009 3.67 2009 4.69 2009 3.31 2009 4.24 2009 2009 3.59 2009 5.36 2010 4.28 2010 3.88 2010 4.1 2010 5.1 2010 4.81 2010 3.91 2010 5.05 2010 3.97 2010 4.91 2010 4.17 2010 4.2 2010 3.3 12 Aug 13 Sep 34 Oct 35 Nov 36 Dec 37 Jan 38 Feb 39 Mar 40 Ape . 41 May 42 Jan 43 Jul 44 Aug 45 Sep 46 Oct 47 Nov 48 Dec 49 Jan 50 Feb 51 Mar 52 Apr 53 May 54 Jun 55 Jul 56 Aug 57 Sep 58 Oct 59 Nov 60 Dec
Step by Step Solution
There are 3 Steps involved in it

Get step-by-step solutions from verified subject matter experts