

Question: Consider a two-class classification problem where the data in each class is modeled by a 2D Gaussian density N(H1, E1) and N(H2, 22). Data Generation
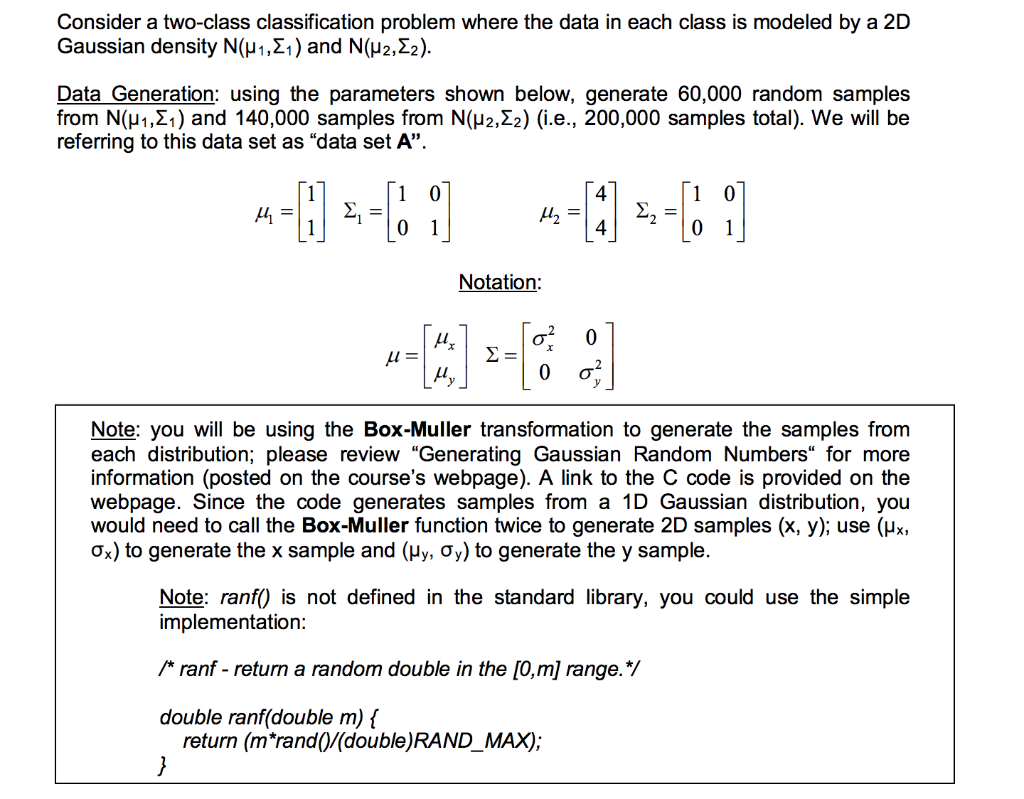
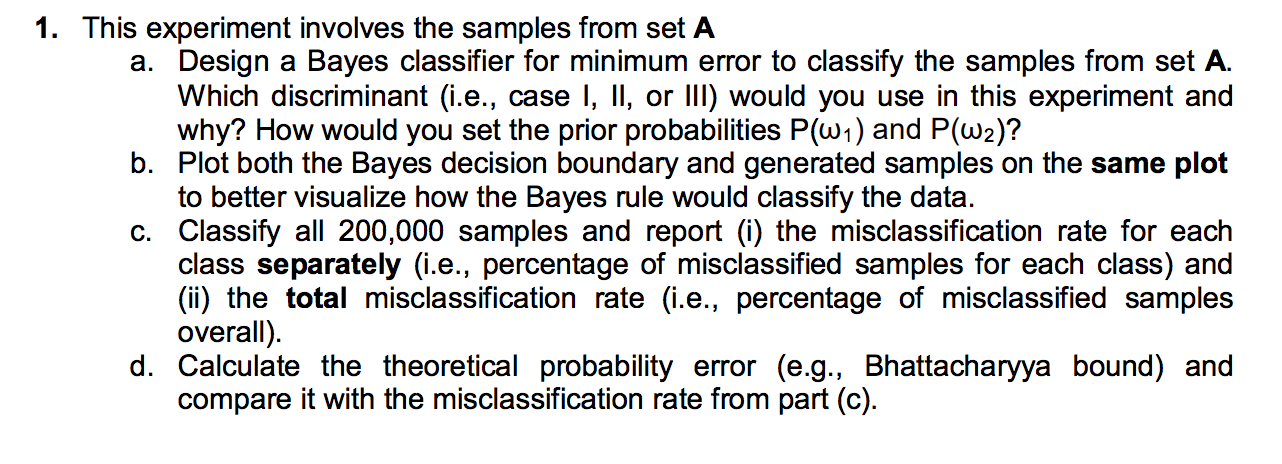
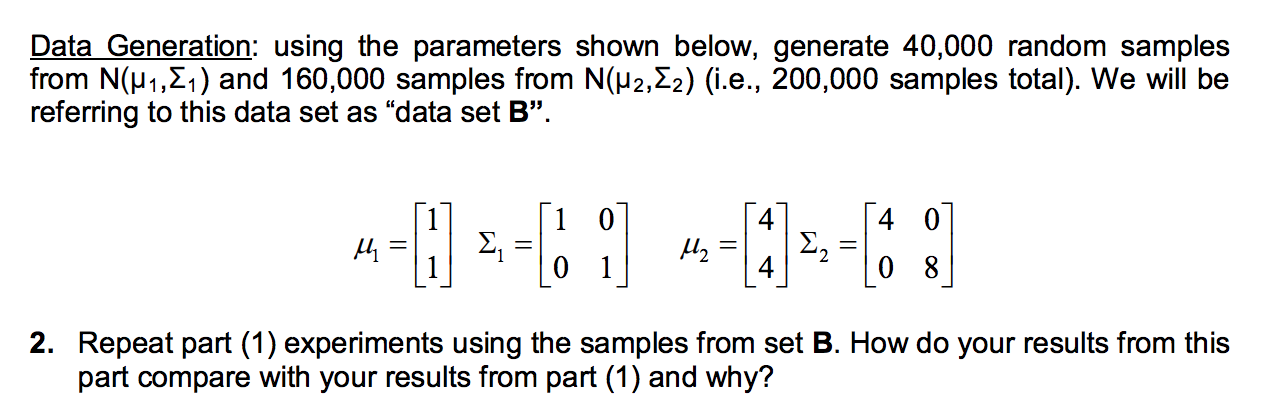
Consider a two-class classification problem where the data in each class is modeled by a 2D Gaussian density N(H1, E1) and N(H2, 22). Data Generation using the parameters shown below, generate 60,000 random samples from N(H1,21) and 140,000 samples from N(H2, E2) (i.e., 200,000 samples total). We will be referring to this data set as "data set A. u = -- N , Loi U2 = : -1 6 ] Notation: U= 0 0 0 0 uy Note: you will be using the Box-Muller transformation to generate the samples from each distribution; please review "Generating Gaussian Random Numbers for more information (posted on the course's webpage). A link to the C code is provided on the webpage. Since the code generates samples from a 10 Gaussian distribution, you would need to call the Box-Muller function twice to generate 2D samples (x, y); use (Hx, 0x) to generate the x sample and (My, Oy) to generate the y sample. Note: ranf() is not defined in the standard library, you could use the simple implementation: /* rant - return a random double in the [0, m] range. */ double ranf(double m) { return (m*rand()/(double)RAND_MAX); } 1. This experiment involves the samples from set A a. Design a Bayes classifier for minimum error to classify the samples from set A. Which discriminant (i.e., case I, II, or III) would you use in this experiment and why? How would you set the prior probabilities P(W1) and P(W2)? b. Plot both the Bayes decision boundary and generated samples on the same plot to better visualize how the Bayes rule would classify the data. C. Classify all 200,000 samples and report (i) the misclassification rate for each class separately (i.e., percentage of misclassified samples for each class) and (ii) the total misclassification rate (i.e., percentage of misclassified samples overall). d. Calculate the theoretical probability error (e.g., Bhattacharyya bound) and compare it with the misclassification rate from part (c). Data Generation: using the parameters shown below, generate 40,000 random samples from N(u1, E1) and 160,000 samples from N(H2,22) (i.e., 200,000 samples total). We will be referring to this data set as data set B. 1 0 4 0 , U2 = (1 0 1 0 8 2. Repeat part (1) experiments using the samples from set B. How do your results from this part compare with your results from part (1) and why? Consider a two-class classification problem where the data in each class is modeled by a 2D Gaussian density N(H1, E1) and N(H2, 22). Data Generation using the parameters shown below, generate 60,000 random samples from N(H1,21) and 140,000 samples from N(H2, E2) (i.e., 200,000 samples total). We will be referring to this data set as "data set A. u = -- N , Loi U2 = : -1 6 ] Notation: U= 0 0 0 0 uy Note: you will be using the Box-Muller transformation to generate the samples from each distribution; please review "Generating Gaussian Random Numbers for more information (posted on the course's webpage). A link to the C code is provided on the webpage. Since the code generates samples from a 10 Gaussian distribution, you would need to call the Box-Muller function twice to generate 2D samples (x, y); use (Hx, 0x) to generate the x sample and (My, Oy) to generate the y sample. Note: ranf() is not defined in the standard library, you could use the simple implementation: /* rant - return a random double in the [0, m] range. */ double ranf(double m) { return (m*rand()/(double)RAND_MAX); } 1. This experiment involves the samples from set A a. Design a Bayes classifier for minimum error to classify the samples from set A. Which discriminant (i.e., case I, II, or III) would you use in this experiment and why? How would you set the prior probabilities P(W1) and P(W2)? b. Plot both the Bayes decision boundary and generated samples on the same plot to better visualize how the Bayes rule would classify the data. C. Classify all 200,000 samples and report (i) the misclassification rate for each class separately (i.e., percentage of misclassified samples for each class) and (ii) the total misclassification rate (i.e., percentage of misclassified samples overall). d. Calculate the theoretical probability error (e.g., Bhattacharyya bound) and compare it with the misclassification rate from part (c). Data Generation: using the parameters shown below, generate 40,000 random samples from N(u1, E1) and 160,000 samples from N(H2,22) (i.e., 200,000 samples total). We will be referring to this data set as data set B. 1 0 4 0 , U2 = (1 0 1 0 8 2. Repeat part (1) experiments using the samples from set B. How do your results from this part compare with your results from part (1) and why
Step by Step Solution
There are 3 Steps involved in it

Get step-by-step solutions from verified subject matter experts