

Question: Consider a Wi-Fi access point (AP) servicing downstream traffic using a CSMA-like (random access) MAC protocol. Assume that the inter-arrival time between any two consecutive
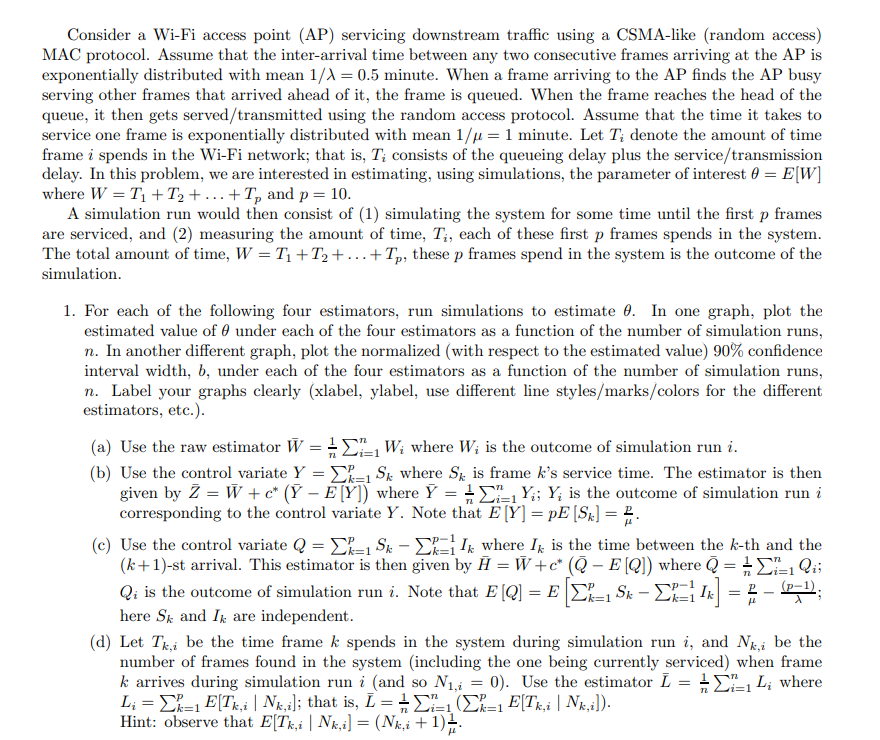
Consider a Wi-Fi access point (AP) servicing downstream traffic using a CSMA-like (random access) MAC protocol. Assume that the inter-arrival time between any two consecutive frames arriving at the AP is exponentially distributed with mean 1/1 = 0.5 minute. When a frame arriving to the AP finds the AP busy serving other frames that arrived ahead of it, the frame is queued. When the frame reaches the head of the queue, it then gets served/transmitted using the random access protocol. Assume that the time it takes to service one frame is exponentially distributed with mean 1/4 = 1 minute. Let T; denote the amount of time frame i spends in the Wi-Fi network; that is, T; consists of the queueing delay plus the service/transmission delay. In this problem, we are interested in estimating, using simulations, the parameter of interest 8 = E[W] where W = T1+T2 + ... +T, and p = 10. A simulation run would then consist of (1) simulating the system for some time until the first p frames P are serviced, and (2) measuring the amount of time, Ti, each of these first p frames spends in the system. The total amount of time, W = T1+T2+...+Tp, these p frames spend in the system is the outcome of the simulation. 1. For each of the following four estimators, run simulations to estimate 6. In one graph, plot the estimated value of @ under each of the four estimators as a function of the number of simulation runs, n. In another different graph, plot the normalized (with respect to the estimated value) 90% confidence interval width, b, under each of the four estimators as a function of the number of simulation runs, n. Label your graphs clearly (xlabel, ylabel, use different line styles/marks/colors for the different estimators, etc.). (a) Use the raw estimator W = = D1- W; where W; is the outcome of simulation run i. (b) Use the control variate Y = {k=1 Sk where SE is frame k's service time. The estimator is then given by Z = W + c* (Y - E [Y]) where Y = + L-LY; Y; is the outcome of simulation run i corresponding to the control variate Y. Note that E [Y] =pE (Sk) = (e) Use the control variate Q = {k=1 Sk - El=114 where It is the time between the k-th and the (k+1)-st arrival. This estimator is then given by H = W +c* (Q - E(Q)) where Q = + L1=1 Qi; Qi is the outcome of simulation run i. Note that E (Q] = E (EK=1 Sk - EK? Ix] = - 157L); (p- IK here Sk and I are independent. (d) Let Tki be the time frame k spends in the system during simulation run i, and Nk,i be the number of frames found in the system (including the one being currently serviced) when frame k arrives during simulation run i (and so N1,1 = 0). Use the estimator I = = D1=1 L; where L; = {k=1 E[Tk,i Nx,i]; that is, I = + L-(k-i E[Tk,i Nx,i]). Hint: observe that E[Tk,i | Nx,i] = (Nk,i+1) 72 i=1 n = = P k=1 ni=1 =1
Step by Step Solution
There are 3 Steps involved in it

Get step-by-step solutions from verified subject matter experts