

Question: Consider data given in HW 2 _ Data _ A Microsoft Excel Comma Separated Values ( . csv ) file about laptop prices. Using the
Consider data given in HWDataA Microsoft Excel Comma Separated Values csv file about laptop prices.
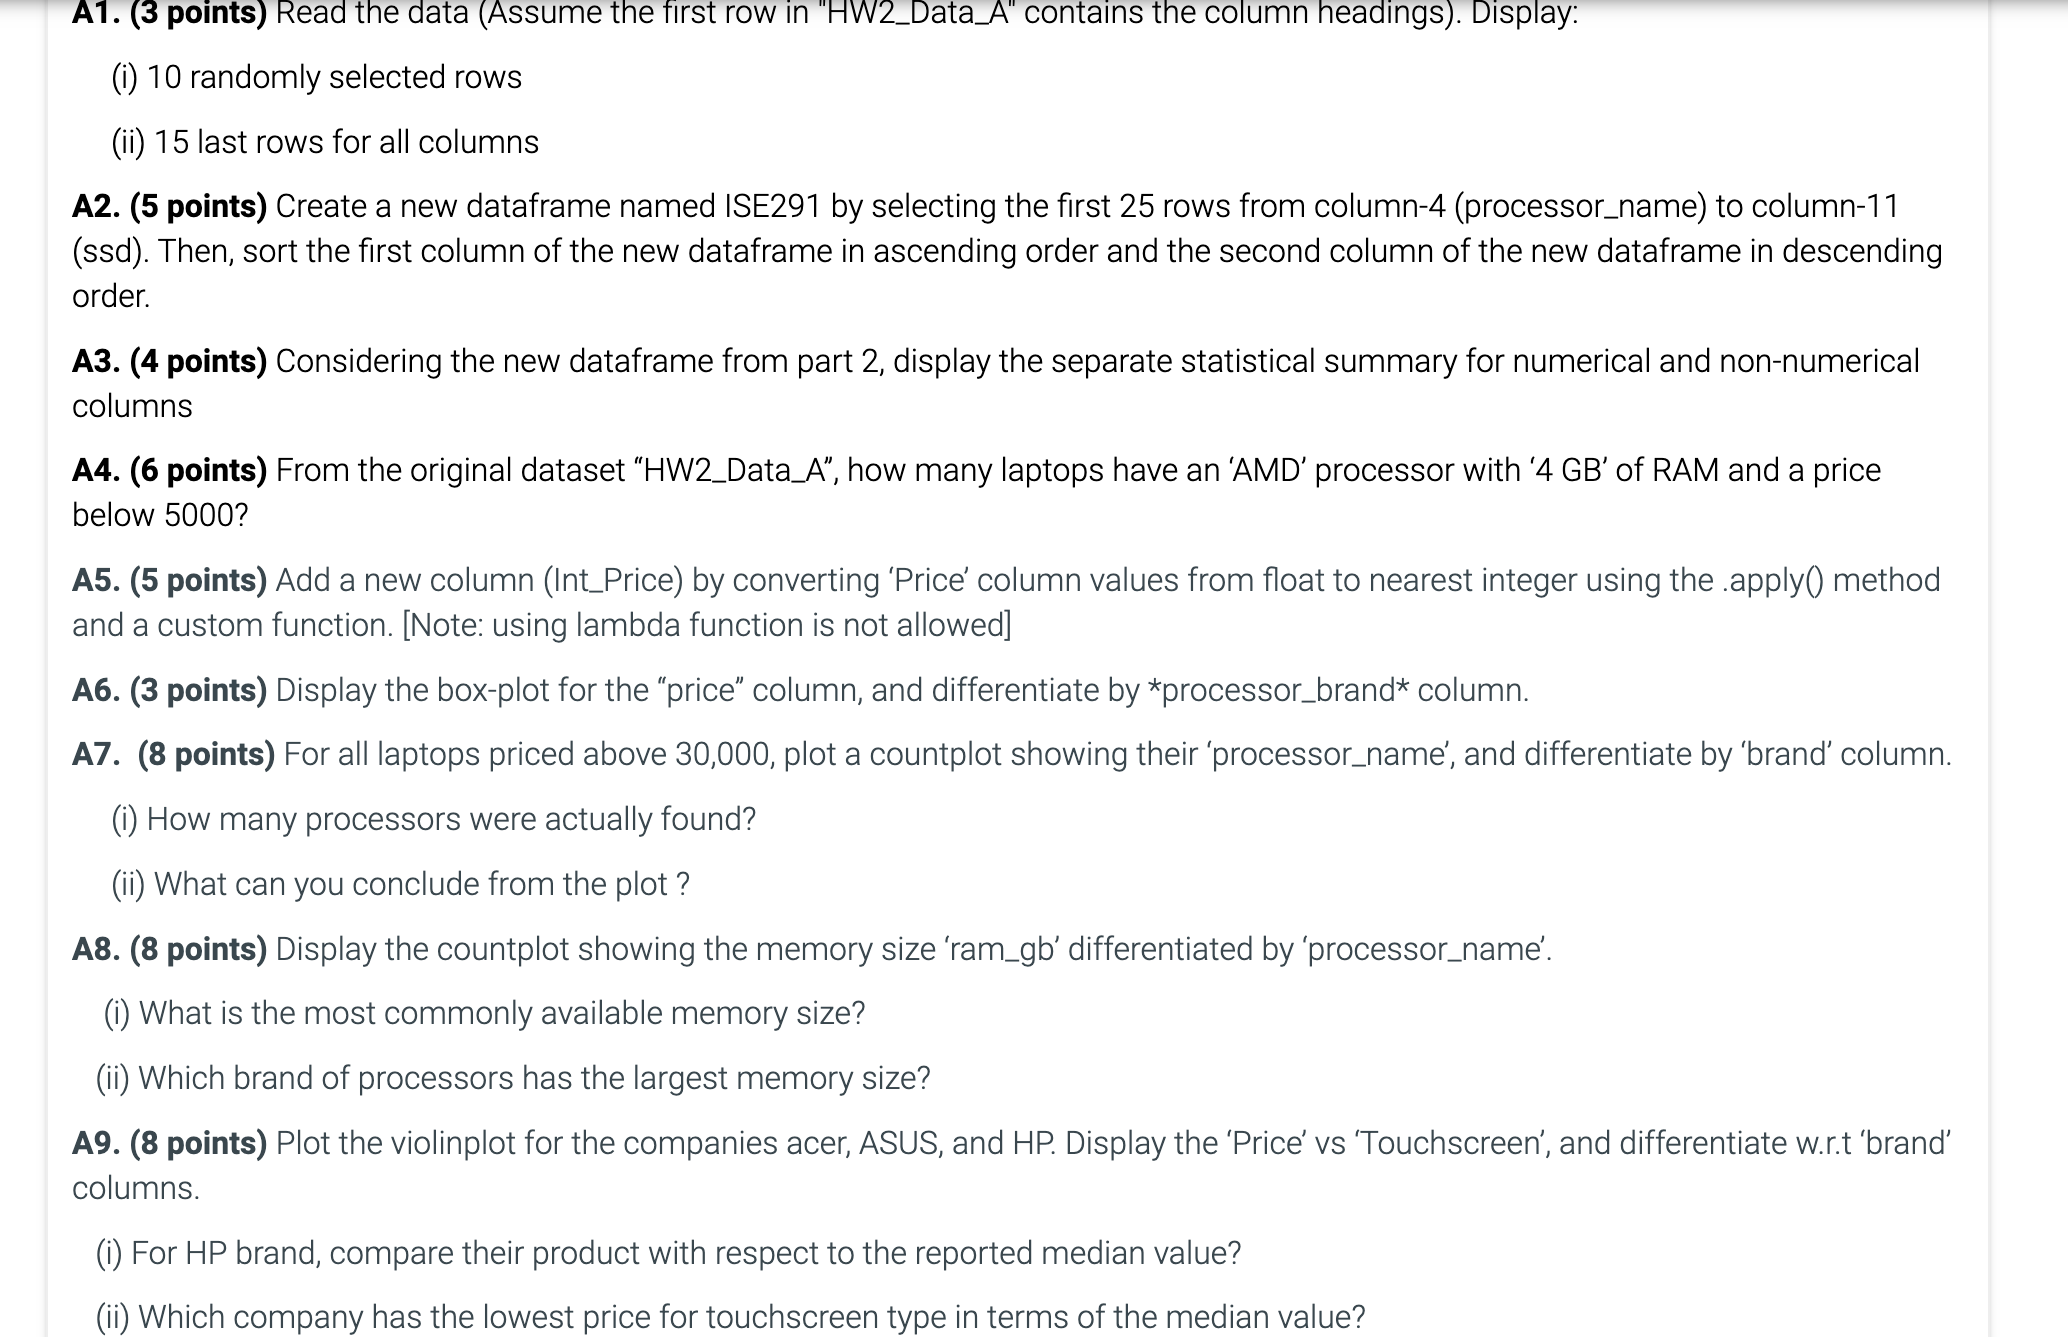
Using the given data, do the tasks given below. A points Read the data Assume the first row in HWDataA contains the column headings Display:
i randomly selected rows
ii last rows for all columns
A points Create a new dataframe named ISE by selecting the first rows from columnprocessorname to columnssd Then, sort the first column of the new dataframe in ascending order and the second column of the new dataframe in descending order.
A points Considering the new dataframe from part display the separate statistical summary for numerical and nonnumerical columns
A points From the original dataset HWDataA how many laptops have an 'AMD' processor with GB of RAM and a price below
A points Add a new column IntPrice by converting 'Price' column values from float to nearest integer using the apply method and a custom function. Note: using lambda function is not allowed
A points Display the boxplot for the "price" column, and differentiate by processorbrand column.
A points For all laptops priced above plot a countplot showing their 'processorname', and differentiate by 'brand' column.
i How many processors were actually found?
ii What can you conclude from the plot?
A points Display the countplot showing the memory size 'ramgb differentiated by 'processorname'.
i What is the most commonly available memory size?
ii Which brand of processors has the largest memory size?
A points Plot the violinplot for the companies acer, ASUS, and HP Display the 'Price' vs 'Touchscreen', and differentiate wrt 'brand' columns.
i For HP brand, compare their product with respect to the reported median value?
ii Which company has the lowest price for touchscreen type in terms of the median value?
Step by Step Solution
There are 3 Steps involved in it
1 Expert Approved Answer
Step: 1 Unlock

Question Has Been Solved by an Expert!
Get step-by-step solutions from verified subject matter experts
Step: 2 Unlock
Step: 3 Unlock