

Question: Consider data published on n = 27 Icukcmnia patients. The data (leukemia rcmission.csv) has a response variable of whether Icukcmia remission occurred (REMISS), which is
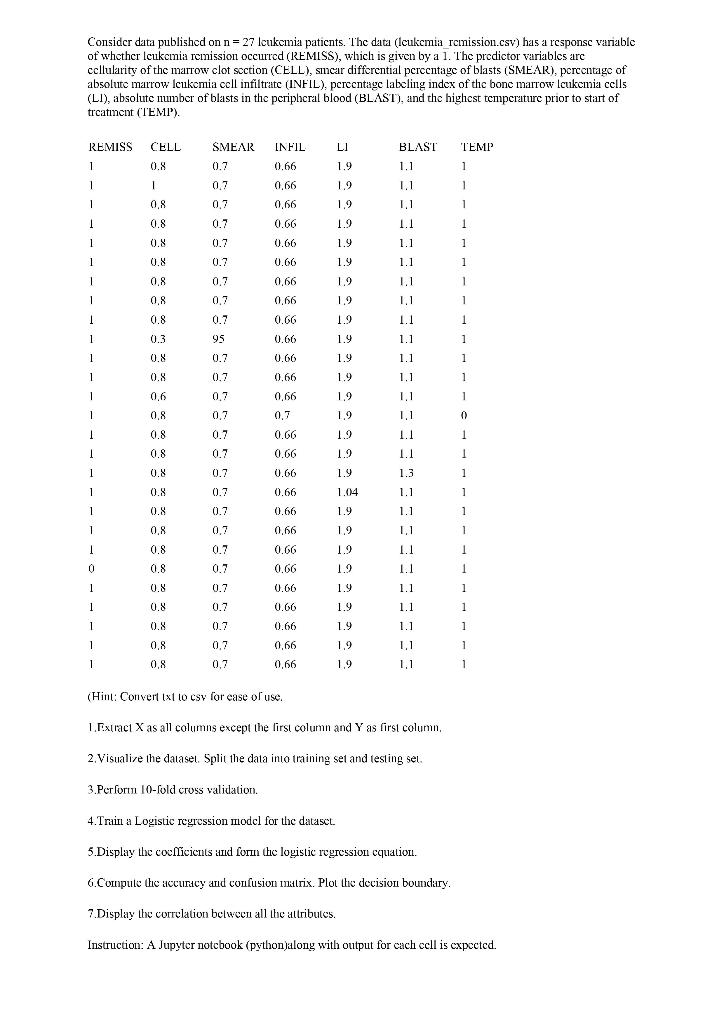
Consider data published on n = 27 Icukcmnia patients. The data (leukemia rcmission.csv) has a response variable of whether Icukcmia remission occurred (REMISS), which is given by a 1. The predictor variables are cellularity of the marrow clot section (CELL), smear differential percentage of blasts (SMEAR), percentage of absolute marrow leukemia cell infiltrate (INFIL), percentage labeling index of the bone marrow leukemia cells (LI), absolute number of blasts in the periphcral blood (BLAST), and the highest temperature prior to start of treatment (TEMP"). REMISS CELL SMEAR INFIL LI BLAST TEMP 1 0.7 1.9 1.1 0.8 1 0.66 0.66 1 1 1 0.7 1.9 1 0,8 0,7 1.9 1 0.66 0.66 1 0.8 0.7 1.9 1.1 1.1 1.1 1.1 1.1 1 1 0.8 0.7 0.66 1 1.9 1.9 1 0.8 0.7 0.66 1 1 0,8 1.9 1 0.7 0,7 0,66 0,66 1 1 0,8 1.9 1 1.1 1,1 1.1 1.1 1 1 0.8 0.7 0.66 1.9 1 1 0.3 95 0.66 1.9 1 1 0.8 0.7 0.66 1 1.9 1.9 1 1 0.8 1.1 1 0.7 0.7 0.66 0.66 1 1 0,6 1,1 1 1.9 1.9 1 0,8 07 0.7 1.1 1 0.8 0.7 0.66 1.1 1 1.9 1.9 1 0.8 0.7 0.66 1.1 1 1 0.8 0.7 0.66 1.3 1.9 1.04 1 1 1 1 0.8 0.7 0.66 1 0.8 0.7 0.66 1.9 1.1 1 1 0,8 0.7 1.9 1,1 1 0.66 0.66 1 0.8 0.7 1.9 1.1 1 0 0.8 0.7 0.66 1.9 1.1 1 1 0.8 0.7 1.9 1.1 1 1 0.66 0.66 1 0.8 0.7 1.9 1.1 1 1 1 1 0.8 0.7 0.66 1.9 1.1 1 0.8 0.7 1.9 1,1 0.66 0,66 1 1 1 1 0.8 0,7 1.9 1.1 (Hint: Convert ixt locsy for ease of use. LExtract X as all columns except the lirst column and Y as first column, 2. Visualize the dataset. Split the data into training set and testing sel. 3.Perforu. 10-fold cross validation. 4.Train a Logistic regression model for the datasct. 5.Display the coeficients and for the logistic regression equation. 6.Compute the accuracy and coulusion matrix. Plot the decision boundary. 7. Display the correlation between all the attributes. Instruction: A Jupytcr notcbook (python along with output for cach cell is expected. Consider data published on n = 27 Icukcmnia patients. The data (leukemia rcmission.csv) has a response variable of whether Icukcmia remission occurred (REMISS), which is given by a 1. The predictor variables are cellularity of the marrow clot section (CELL), smear differential percentage of blasts (SMEAR), percentage of absolute marrow leukemia cell infiltrate (INFIL), percentage labeling index of the bone marrow leukemia cells (LI), absolute number of blasts in the periphcral blood (BLAST), and the highest temperature prior to start of treatment (TEMP"). REMISS CELL SMEAR INFIL LI BLAST TEMP 1 0.7 1.9 1.1 0.8 1 0.66 0.66 1 1 1 0.7 1.9 1 0,8 0,7 1.9 1 0.66 0.66 1 0.8 0.7 1.9 1.1 1.1 1.1 1.1 1.1 1 1 0.8 0.7 0.66 1 1.9 1.9 1 0.8 0.7 0.66 1 1 0,8 1.9 1 0.7 0,7 0,66 0,66 1 1 0,8 1.9 1 1.1 1,1 1.1 1.1 1 1 0.8 0.7 0.66 1.9 1 1 0.3 95 0.66 1.9 1 1 0.8 0.7 0.66 1 1.9 1.9 1 1 0.8 1.1 1 0.7 0.7 0.66 0.66 1 1 0,6 1,1 1 1.9 1.9 1 0,8 07 0.7 1.1 1 0.8 0.7 0.66 1.1 1 1.9 1.9 1 0.8 0.7 0.66 1.1 1 1 0.8 0.7 0.66 1.3 1.9 1.04 1 1 1 1 0.8 0.7 0.66 1 0.8 0.7 0.66 1.9 1.1 1 1 0,8 0.7 1.9 1,1 1 0.66 0.66 1 0.8 0.7 1.9 1.1 1 0 0.8 0.7 0.66 1.9 1.1 1 1 0.8 0.7 1.9 1.1 1 1 0.66 0.66 1 0.8 0.7 1.9 1.1 1 1 1 1 0.8 0.7 0.66 1.9 1.1 1 0.8 0.7 1.9 1,1 0.66 0,66 1 1 1 1 0.8 0,7 1.9 1.1 (Hint: Convert ixt locsy for ease of use. LExtract X as all columns except the lirst column and Y as first column, 2. Visualize the dataset. Split the data into training set and testing sel. 3.Perforu. 10-fold cross validation. 4.Train a Logistic regression model for the datasct. 5.Display the coeficients and for the logistic regression equation. 6.Compute the accuracy and coulusion matrix. Plot the decision boundary. 7. Display the correlation between all the attributes. Instruction: A Jupytcr notcbook (python along with output for cach cell is expected
Step by Step Solution
There are 3 Steps involved in it

Get step-by-step solutions from verified subject matter experts