Question: Consider Example 1 page 286. Reconfigure the crossover points for the different processes given that: - Cost per accounting report for Software A is: 70$
Consider Example 1 page 286. Reconfigure the crossover points for the different processes given that:
- Cost per accounting report for Software A is: 70$
- Cost per accounting report for Software B is: $35
- Cost per accounting report for Software C is: $20
- All other total fixed costs remain the same.
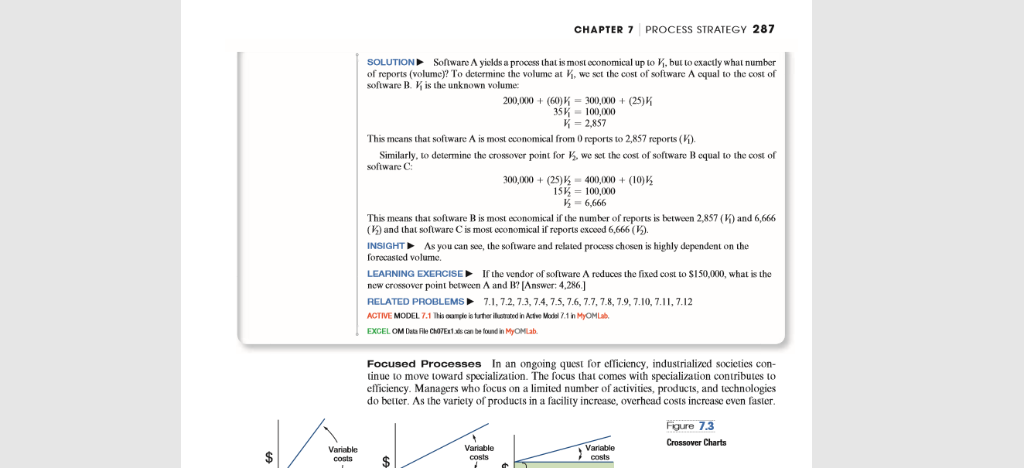
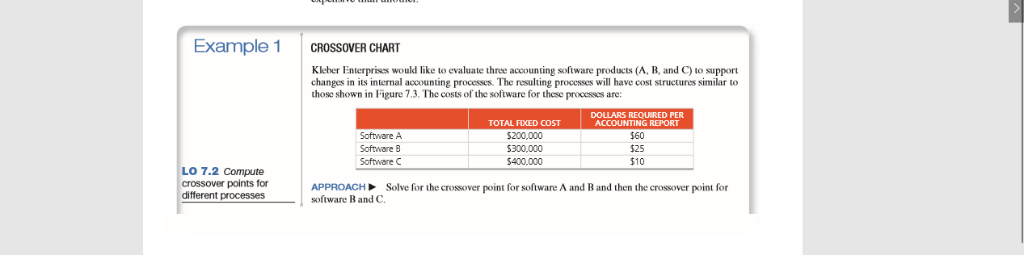
CHAPTER 7 PROCESS STRATEGY 287 SOLUTION Software A yields a process that is most economical up to kj, but to exactly what number of reports (volume)? To determine the volume at K, we set the cost of software A equal to the cost of software B. K is the unknown volume 200,000 + (60)K = 300,000 + (25)K 35K - 100,000 K = 2,857 This means that software A is most economical from 0 reports to 2,857 reports (). Similarly, to determine the crossover point for 15, we set the cost of software B equal to the cost of software C: 300,000 + (25)15 - 400,000 + (10)K 15K, = 100,000 K = 6,666 This means that software B is most economical if the number of reports is between 2,857 (1) and 6,666 (F) and that software C is most economical if reports exceed 6,666 (19). INSIGHT As you can see, the software and related process chosen is highly dependent on the forecasted volume. LEARNING EXERCISED If the vendor of software A reduces the fixed cost to $150,000, what is the new crossover point between A and B? [Answer: 4.286.] RELATED PROBLEMS 7.1, 7.2, 7.3, 7.4, 7.5, 7.6, 7.7, 7.8, 7.9, 7.10, 7.11, 7.12 ACTIVE MODEL 7.1 This campe is farher ilunoted in Active Model 7.1 in MyOMLab. EXCEL OM Data File ChoVEx1 xis can be found in MyOHLab. Focused Processes In an ongoing quest for efficiency, industrialized societies con- tinue to move toward specialization. The focus that comes with specialization contributes to efficiency. Managers who focus on a limited number of activities, products, and technologies do better. As the variety of products in a facility increase, overhead costs increase even faster. Figure 7.3 Crossover Charts Variable Variable Variable Costa Costs coylyExample 1 CROSSOVER CHART Kleber Enterprises would like to evaluate three accounting software products (A, B, and C) to support changes in its internal accounting processes. The resulting processes will have cost structures similar to those shown in Figure 7.3. The costs of the software for these processes are: DOLLARS REQU RED PER TOTAL FIXED COST ACCOUNTING REPORT Software A $200,000 160 Software B $300,000 $25 Software C $400,000 $10 LO 7.2 Compute crossover points for APPROACH Solve for the crossover point for software A and B and then the crossover point for different processes software B and C