

Question: Consider Figs. 1 and 2 given below which are 2-D grayscale representations of 16 sinusoidal images a) Now consider Figs. 3 and 4. Giving a
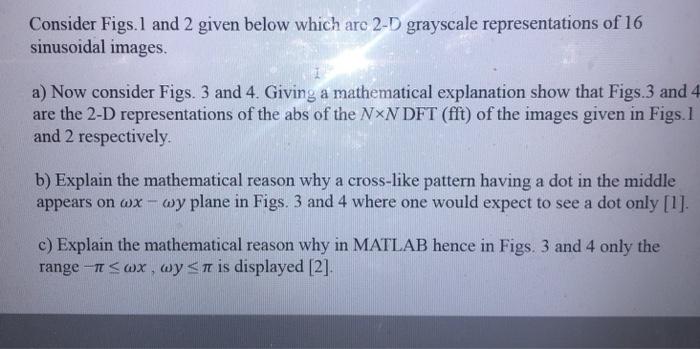
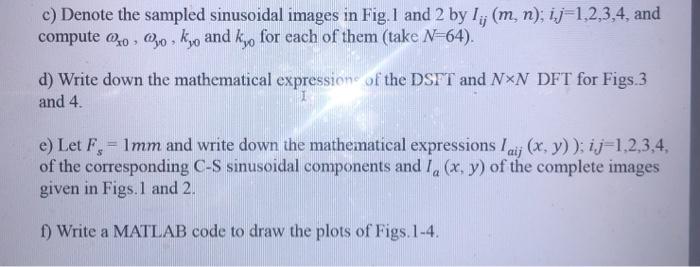
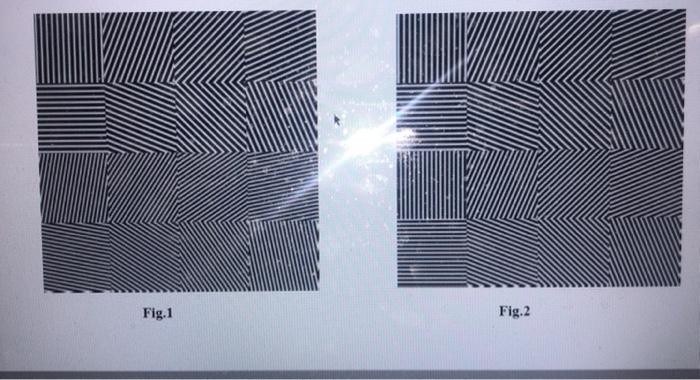
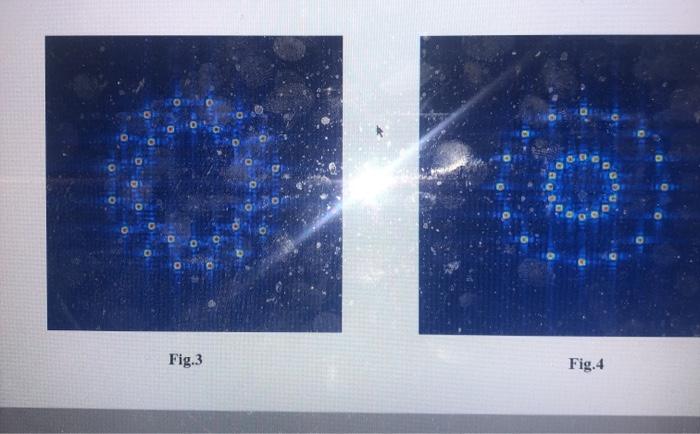
Consider Figs. 1 and 2 given below which are 2-D grayscale representations of 16 sinusoidal images a) Now consider Figs. 3 and 4. Giving a mathematical explanation show that Figs. 3 and 4 are the 2-D representations of the abs of the NxN DFT (fft) of the images given in Figs. 1 and 2 respectively. b) Explain the mathematical reason why a cross-like pattern having a dot in the middle appears on wx wy plane in Figs. 3 and 4 where one would expect to see a dot only [1]. c) Explain the mathematical reason why in MATLAB hence in Figs. 3 and 4 only the range - Swx, wys is displayed [2] c) Denote the sampled sinusoidal images in Fig.1 and 2 by Ij (m, n); ij=1,2,3,4, and compute 0x0, Qvo, kyo and kyo for each of them (take N-64). d) Write down the mathematical expression of the DSTT and NN DFT for Figs. 3 and 4 e) Let Fs - 1mm and write down the mathematical expressions I aij (x, y)); 1.j=1,2,3,4, of the corresponding C-S sinusoidal components and 1, (x, y) of the complete images given in Figs. 1 and 2. 1) Write a MATLAB code to draw the plots of Figs. 1-4. Fig. 1 Fig.2 Fig.3 Fig. 4 Consider Figs. 1 and 2 given below which are 2-D grayscale representations of 16 sinusoidal images a) Now consider Figs. 3 and 4. Giving a mathematical explanation show that Figs. 3 and 4 are the 2-D representations of the abs of the NxN DFT (fft) of the images given in Figs. 1 and 2 respectively. b) Explain the mathematical reason why a cross-like pattern having a dot in the middle appears on wx wy plane in Figs. 3 and 4 where one would expect to see a dot only [1]. c) Explain the mathematical reason why in MATLAB hence in Figs. 3 and 4 only the range - Swx, wys is displayed [2] c) Denote the sampled sinusoidal images in Fig.1 and 2 by Ij (m, n); ij=1,2,3,4, and compute 0x0, Qvo, kyo and kyo for each of them (take N-64). d) Write down the mathematical expression of the DSTT and NN DFT for Figs. 3 and 4 e) Let Fs - 1mm and write down the mathematical expressions I aij (x, y)); 1.j=1,2,3,4, of the corresponding C-S sinusoidal components and 1, (x, y) of the complete images given in Figs. 1 and 2. 1) Write a MATLAB code to draw the plots of Figs. 1-4. Fig. 1 Fig.2 Fig.3 Fig. 4
Step by Step Solution
There are 3 Steps involved in it

Get step-by-step solutions from verified subject matter experts