

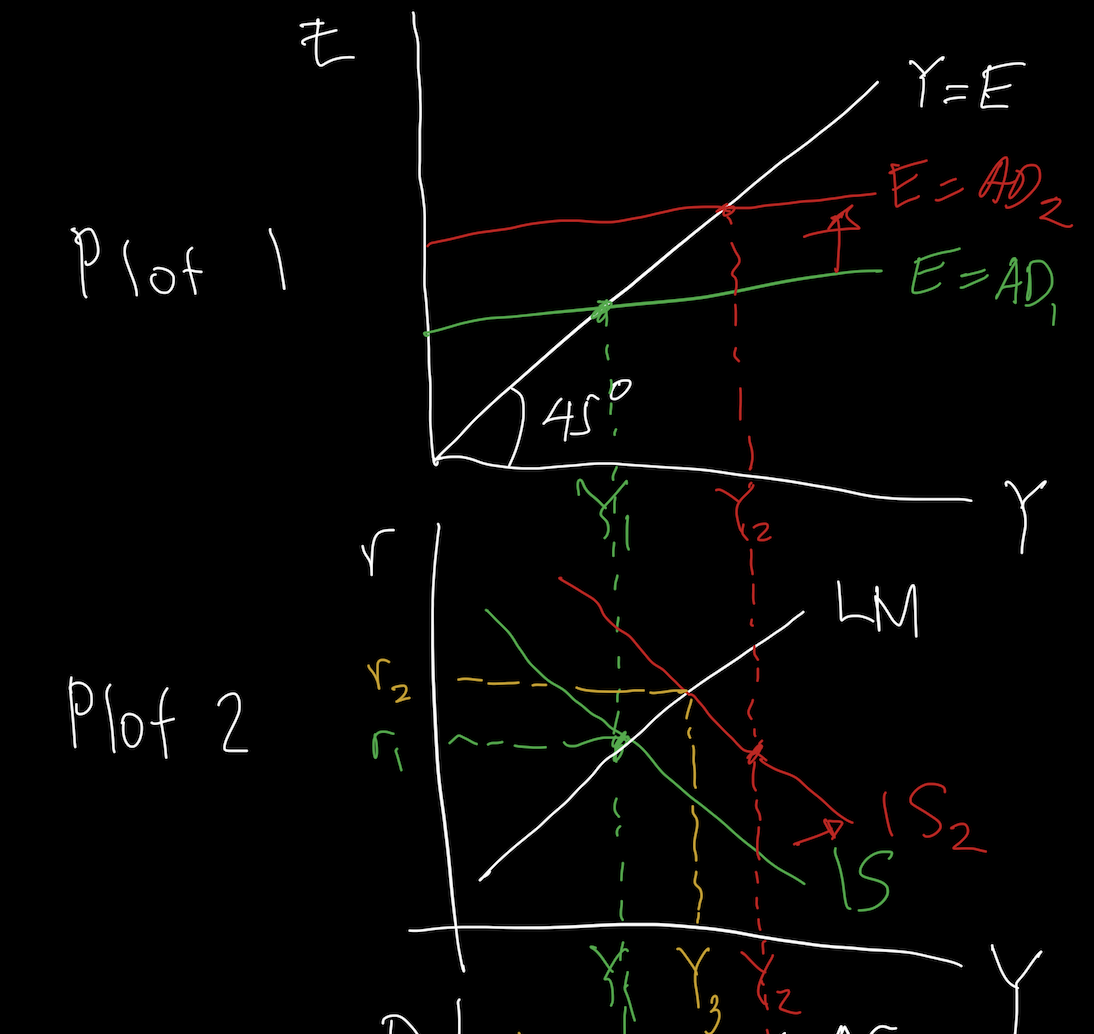
Question: Consider plot 1 and plot 2 , which plot a case of expansionary fiscal policy, as illustrated above. In plot 2 , what is equilibrium
Consider plot and plot which plot a case of expansionary fiscal policy, as illustrated above. In plot what is equilibrium output? Also, compare with the equilibrium output in plot after the fiscal policy is implemented
Group of answer choices
In plot equilibrium output is Y but interest rates are unchanged at r following the fiscal policy portrayed in plot
In plot equilibrium output is Y which is lower than Y The gap between Y and Y may increase if the slope of the IS or LM curve is steeper in the graph, increased slope
In plot equilibrium output is Y exactly the same as equilibrium output in plot Interest rates increase to r due to crowding out effects.
In plot equilibrium output is Y which is lower than Y Interest rates remain unchanged at r
In plot equilibrium output is Y which is lower than Y This is due to crowding out effects as the private sector competes with government for funds, due to the higher interest rates r
Step by Step Solution
There are 3 Steps involved in it
1 Expert Approved Answer
Step: 1 Unlock

Question Has Been Solved by an Expert!
Get step-by-step solutions from verified subject matter experts
Step: 2 Unlock
Step: 3 Unlock