

Question: Consider RR scheduling. Draw a Gantt chart for this 5 processes. Service times and arrival times are given. a. context switch =10, time quantum(time slice)=
Consider RR scheduling. Draw a Gantt chart for this 5 processes.
Service times and arrival times are given.
a. context switch =10, time quantum(time slice)= 50
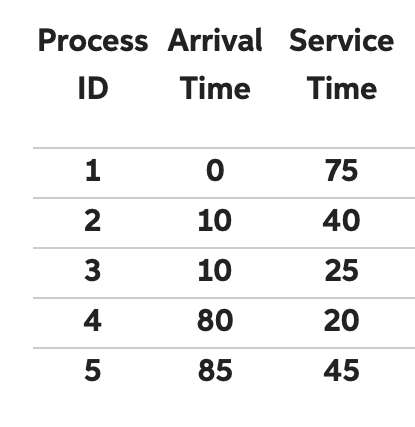
Process Arrival Service ID Time Time \begin{tabular}{ccc} \hline 1 & 0 & 75 \\ \hline 2 & 10 & 40 \\ \hline 3 & 10 & 25 \\ \hline 4 & 80 & 20 \\ \hline 5 & 85 & 45 \\ \hline \end{tabular}
Step by Step Solution
There are 3 Steps involved in it
1 Expert Approved Answer
Step: 1 Unlock

Question Has Been Solved by an Expert!
Get step-by-step solutions from verified subject matter experts
Step: 2 Unlock
Step: 3 Unlock