

Question: Consider that you have generated a classifier. The following table lists the 1 0 test instances used for evaluating your model, where (
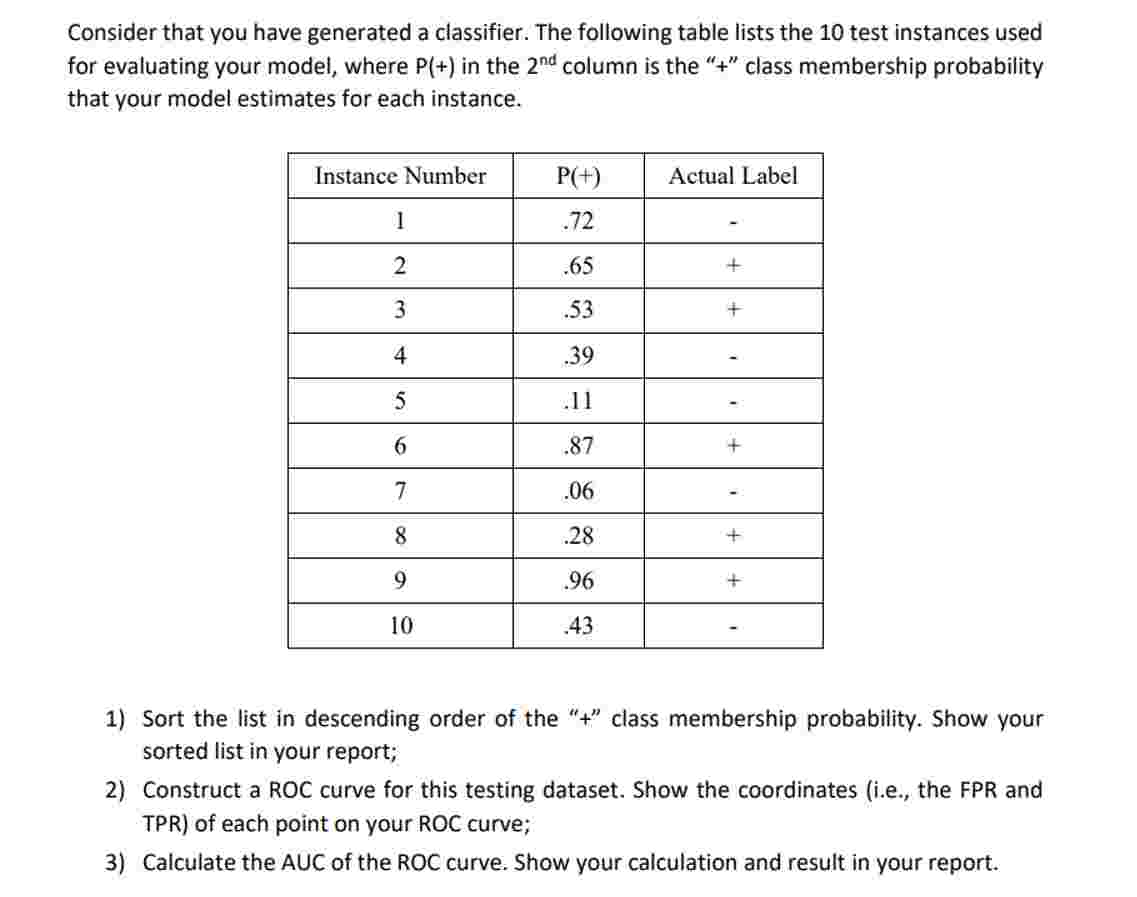
Consider that you have generated a classifier. The following table lists the test instances used for evaluating your model, where mathrmP in the text nd column is the class membership probability that your model estimates for each instance.
begintabularccc
hline Instance Number & mathrmP & Actual Label
hline & &
hline & &
hline & &
hline & &
hline & &
hline & &
hline & &
hline & &
hline & &
hline & &
hline
endtabular
Sort the list in descending order of the class membership probability. Show your sorted list in your report;
Construct a ROC curve for this testing dataset. Show the coordinates ie the FPR and TPR of each point on your ROC curve;
Calculate the AUC of the ROC curve. Show your calculation and result in your report.
Step by Step Solution
There are 3 Steps involved in it
1 Expert Approved Answer
Step: 1 Unlock

Question Has Been Solved by an Expert!
Get step-by-step solutions from verified subject matter experts
Step: 2 Unlock
Step: 3 Unlock