

Question: Consider that your hazard analysis process resulted in the fault tree in the figure. As safety engineer your assignment is to perform an event tree
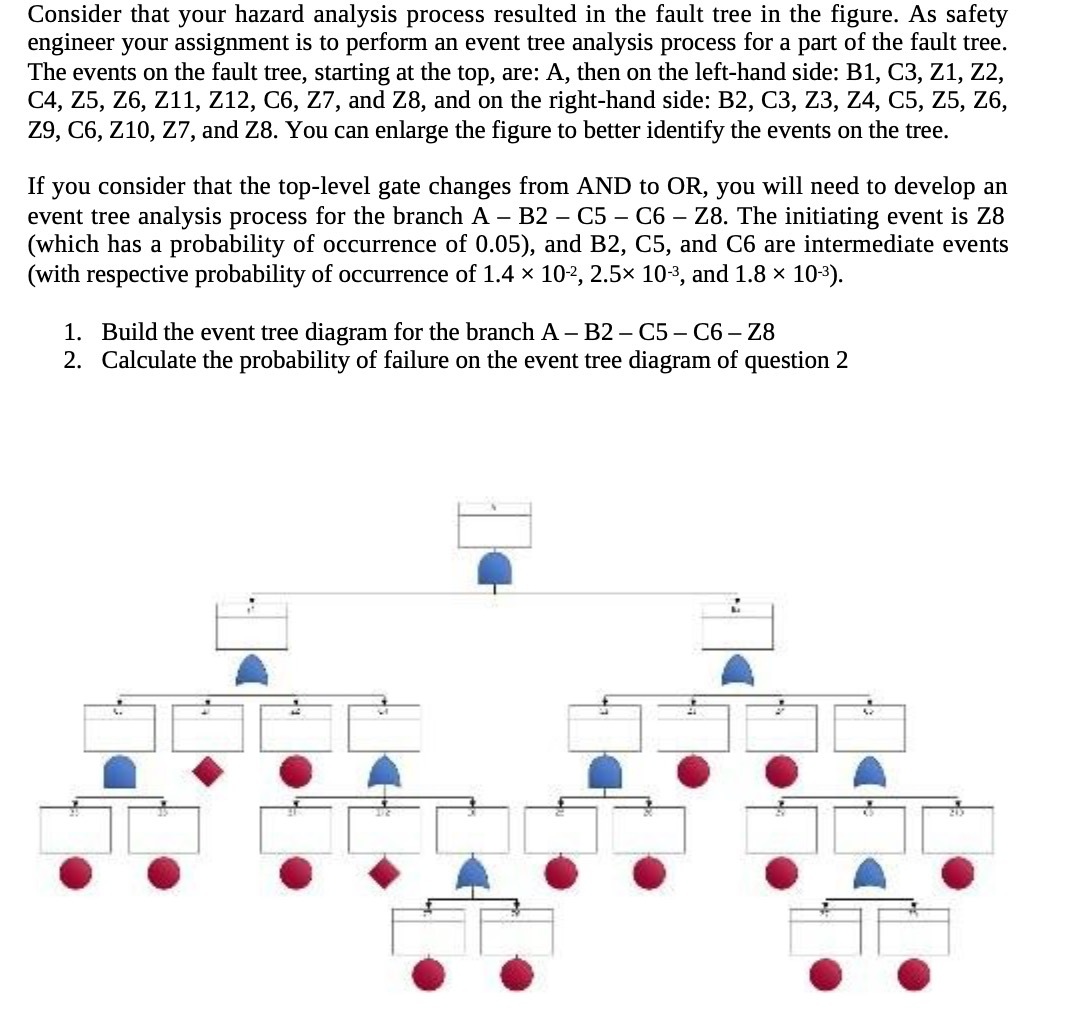

Consider that your hazard analysis process resulted in the fault tree in the figure. As safety engineer your assignment is to perform an event tree analysis process for a part of the fault tree. The events on the fault tree, starting at the top, are: A, then on the left-hand side: B1, C3, Z1, Z2, C4, 75, 76, 211, Z12, C6, Z7, and Z8, and on the right-hand side: B2, C3, Z3, Z4, C5, Z5, Z6, 29, C6, 210, Z7, and Z8. You can enlarge the figure to better identify the events on the tree. If you consider that the top-level gate changes from AND to OR, you will need to develop an event tree analysis process for the branch A B2 C5 C6 Z8. The initiating event is Z8 (which has a probability of occurrence of 0.05), and B2, C5, and C6 are intermediate events (with respective probability of occurrence of 1.4 x 10², 2.5x 10³, and 1.8 x 10%3). 1. Build the event tree diagram for the branch A B2 C5 - C6 Z8 2. Calculate the probability of failure on the event tree diagram of question 2 \\l- i _1_ ] st oy . Fr __l_.__ ey : 1 1| ! 3 ..' ' X X 3 X g
Step by Step Solution
There are 3 Steps involved in it

Get step-by-step solutions from verified subject matter experts