

Question: Consider the Auto data discussed in the class. We use the mpg, displacement, horsepower, and weight variables in the Auto data to dene the auto
Consider the Auto data discussed in the class. We use the mpg, displacement, horsepower, and weight variables in the Auto data to dene the auto data. The definitions of the four variables are in Table 1. We perform dimension reduction using principal components analysis (PCA) on the auto data in two ways using prcomp that result in two outputs named pcout1 and pcout2. The elements of pcout1 and pcout2 are shown below.
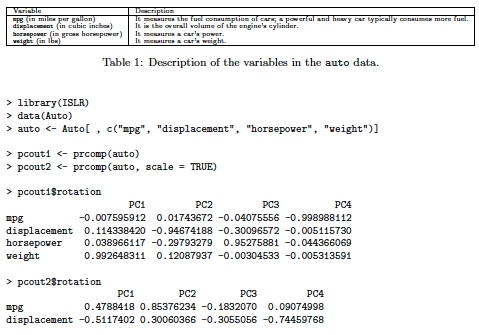
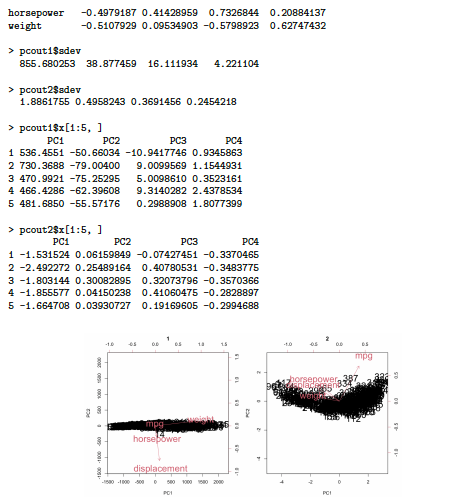
Figure 1: Biplots of the first two principal components obtained using the PCA outputs pcout1 and pcout2.
(i) What is the main difference between the PCA outputs saved in pcout1 and pcout2. Which output is better for interpreting the structure of auto data? Explain in terms of the variables used in the auto data.
(ii) Which elements of pcout1 and pcout2 correspond to principal component scores and principal component loadings vector? What is the maximum number of principal components in pcout1 and pcout2?
(iii) Consider the plots labeled 1 and 2 in Figure 1. Which plot corresponds to pcout1 and pcout2, respectively? Which the elements of the outputs pcout1 and pcout2 are used to plot the black colored points in the two plots? Justify your answers
(iv) Which elements of the outputs pcout1 and pcout2 are used to plot the red-colored arrows in the two plots?
(v) Assume that we use the results of pcout2 and perform dimension reduction to two dimensions (i.e., M = 2). Let zi1, zi2 be the principal component scores of the ith observation and 1, 2 be the principal component loadings vectors. Using the R output above, describe the values and geometric interpretation of (zi1, zi2) for i = 1, 2 in a coordinate system where the first two axes are parallel to 1, 2, respectively.
(vi) Justify the choice of M in the previous question using the proportion of variance explained (PVE) by the individual PCs.
(vii) Consider an application of the PCA outputs for PC regression (PCR) using mpg, displacement, horsepower, and weight as the predictors and acceleration as the response, where acceleration is included in the Auto data (but not in the auto data). Which of the two outputs pcout1 and pcout2 are useful for PCR? Using the notation introduced in the previous questions, describe the PCR equation for predicting acceleration using M = 2. Denoting the sample size as n, clearly describe the regression coefficients and the method for parameter estimation.
FE (in miles per gallon) di incent in cubic inche) horsepower (i grox hormpower) wat in iha) Description Te mesures the fuel consumption of carxa powerful and heavy car typically consumex moe fuel It is the rurall volume of the engine cylinder. Ismar power. It sur car's sight. Table 1: Description of the variables in the auto data. > library (ISLR) >data (Auto) > auto pcouti pcout2 pcout1$rotation PC1 PC2 PC3 PC4 pg -0.007595912 0.01743672 -0.04075556 -0.998988112 displacement 0.114338420 -0.94674188 -0.30096572 -0.005115730 horsepower 0.038966117 -0.29793279 0.95275881 -0.044366069 weight 0.992648311 0.12087937 -0.00304533 -0.005313591 > pcout2$rotation PC1 PC2 PC3 PC4 mpg 0.4788418 0.85376234 -0.1832070 0.09074998 displacement -0.5117402 0.30060366 -0.3055056 -0.74459768 horsepower weight -0.4979187 0.41428959 0.7326844 0.20884137 -0.5107929 0.09534903 -0.5798923 0.62747432 >pcout 1$sdev 855.680253 38.877459 16.111934 4.221104 > pcout2$sdev 1.8861755 0.4958243 0.3691456 0.2454218 > pcout 1$x[1:5, ] PC1 PC2 PC3 PC4 1 536.4551 -50.66034 -10.9417746 0.9345863 2 730.3688 -79.00400 9.0099569 1.1544931 3 470.9921 -75.25295 5.0098610 0.3523161 4 466.4286 -62.39608 9.3140282 2.4378534 5 481.6850 -55.57176 0.2988908 1.8077399 > pcout2$x[1:5, ] PC1 PC2 PC3 PC4 1 -1.531524 0.06159849 -0.07427451 -0.3370465 2 -2.492272 0.25489164 0.40780531 -0.3483775 3 -1.803144 0.30082895 0.32073796 -0.3570366 4 -1.855577 0.04150238 0.41060475 -0.2828897 5 -1.664708 0.03930727 0.19169605 -0.2994688 15 OLD mpg mpg horse bower displacement 500 10000 2000 PCI O FC FE (in miles per gallon) di incent in cubic inche) horsepower (i grox hormpower) wat in iha) Description Te mesures the fuel consumption of carxa powerful and heavy car typically consumex moe fuel It is the rurall volume of the engine cylinder. Ismar power. It sur car's sight. Table 1: Description of the variables in the auto data. > library (ISLR) >data (Auto) > auto pcouti pcout2 pcout1$rotation PC1 PC2 PC3 PC4 pg -0.007595912 0.01743672 -0.04075556 -0.998988112 displacement 0.114338420 -0.94674188 -0.30096572 -0.005115730 horsepower 0.038966117 -0.29793279 0.95275881 -0.044366069 weight 0.992648311 0.12087937 -0.00304533 -0.005313591 > pcout2$rotation PC1 PC2 PC3 PC4 mpg 0.4788418 0.85376234 -0.1832070 0.09074998 displacement -0.5117402 0.30060366 -0.3055056 -0.74459768 horsepower weight -0.4979187 0.41428959 0.7326844 0.20884137 -0.5107929 0.09534903 -0.5798923 0.62747432 >pcout 1$sdev 855.680253 38.877459 16.111934 4.221104 > pcout2$sdev 1.8861755 0.4958243 0.3691456 0.2454218 > pcout 1$x[1:5, ] PC1 PC2 PC3 PC4 1 536.4551 -50.66034 -10.9417746 0.9345863 2 730.3688 -79.00400 9.0099569 1.1544931 3 470.9921 -75.25295 5.0098610 0.3523161 4 466.4286 -62.39608 9.3140282 2.4378534 5 481.6850 -55.57176 0.2988908 1.8077399 > pcout2$x[1:5, ] PC1 PC2 PC3 PC4 1 -1.531524 0.06159849 -0.07427451 -0.3370465 2 -2.492272 0.25489164 0.40780531 -0.3483775 3 -1.803144 0.30082895 0.32073796 -0.3570366 4 -1.855577 0.04150238 0.41060475 -0.2828897 5 -1.664708 0.03930727 0.19169605 -0.2994688 15 OLD mpg mpg horse bower displacement 500 10000 2000 PCI O FCStep by Step Solution
There are 3 Steps involved in it

Get step-by-step solutions from verified subject matter experts