

Question: Consider the below graph: E(R) E(RM) R stocks M stocks What is the slope of the graph? If the historical return of an individual
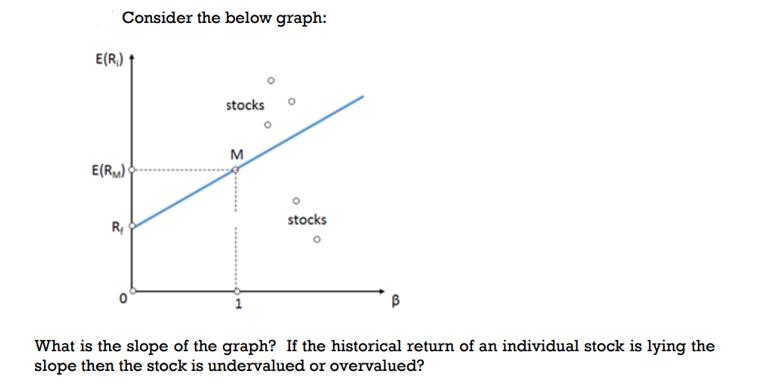
Consider the below graph: E(R) E(RM) R stocks M stocks What is the slope of the graph? If the historical return of an individual stock is lying the slope then the stock is undervalued or overvalued?
Step by Step Solution
There are 3 Steps involved in it
1 Expert Approved Answer
Step: 1 Unlock

The graph depicted in the image is a representation of the Capital Asset Pricing Model CAPM which is ... View full answer
Question Has Been Solved by an Expert!
Get step-by-step solutions from verified subject matter experts
Step: 2 Unlock
Step: 3 Unlock