

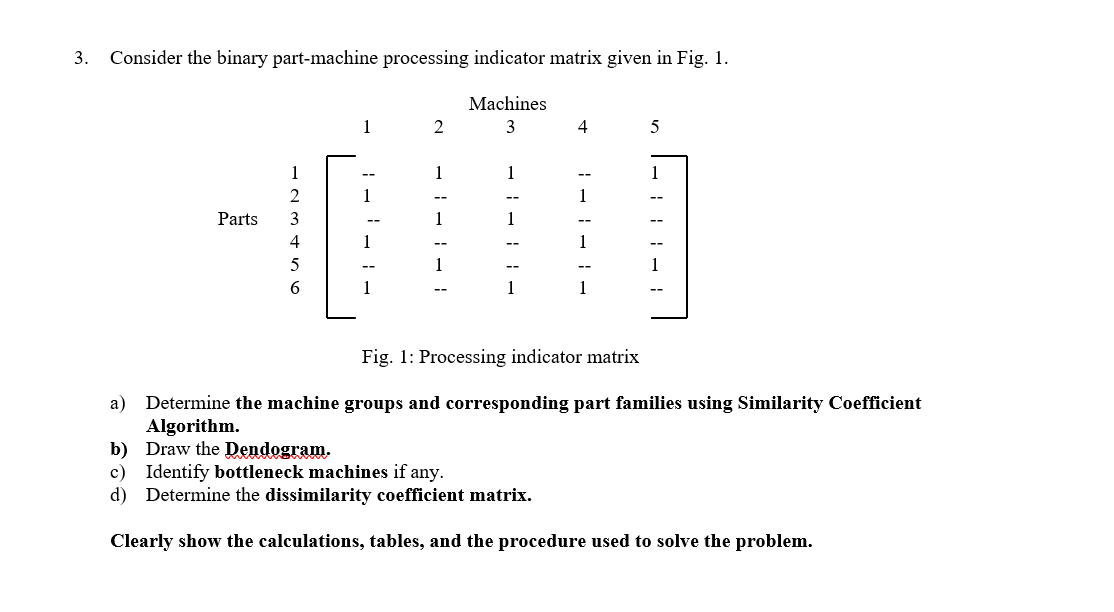
Question: Consider the binary part - machine processing indicator matrix given in Fig. 1 . Fig. 1 : Processing indicator matrix a ) Determine the machine
Consider the binary partmachine processing indicator matrix given in Fig.
Fig. : Processing indicator matrix
a Determine the machine groups and corresponding part families using Similarity Coefficient
Algorithm.
b Draw the Dendogram.
c Identify bottleneck machines if any.
d Determine the dissimilarity coefficient matrix.
Clearly show the calculations, tables, and the procedure used to solve the problem. Need all the steps with clear explanation. please no summary on how to do it
Step by Step Solution
There are 3 Steps involved in it
1 Expert Approved Answer
Step: 1 Unlock

Question Has Been Solved by an Expert!
Get step-by-step solutions from verified subject matter experts
Step: 2 Unlock
Step: 3 Unlock