

Question: Consider the boxplot below. 33 47 63 10 20 30 40 50 60 70 80 data Q a. What quarter has the smallest spread of
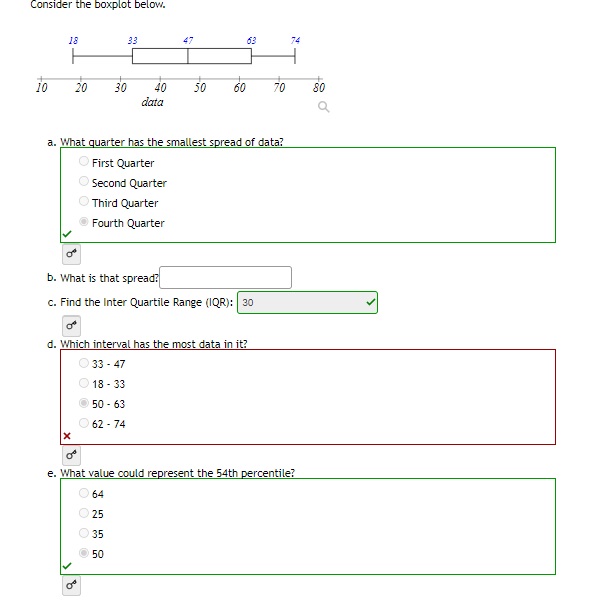
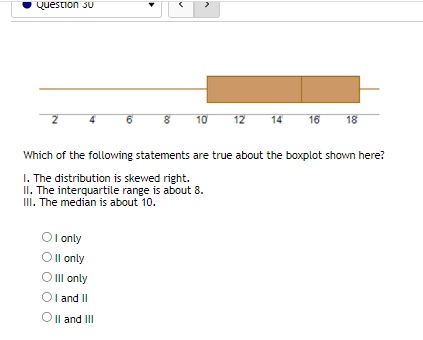
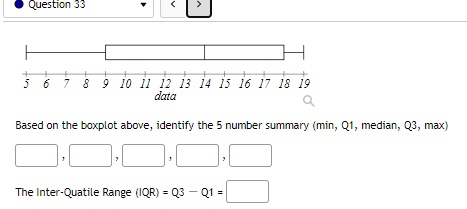
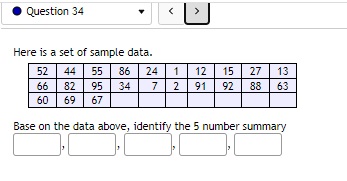
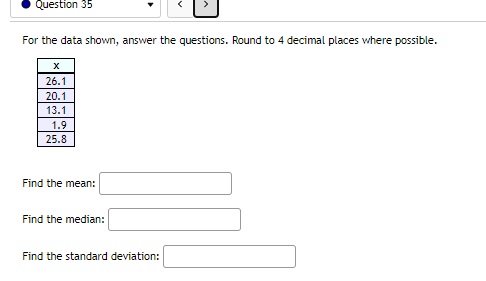
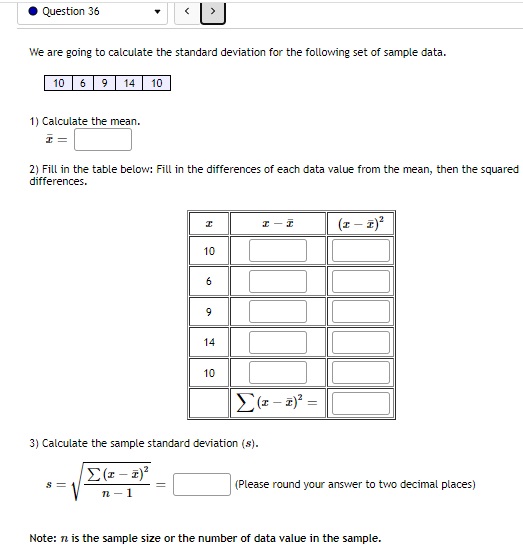
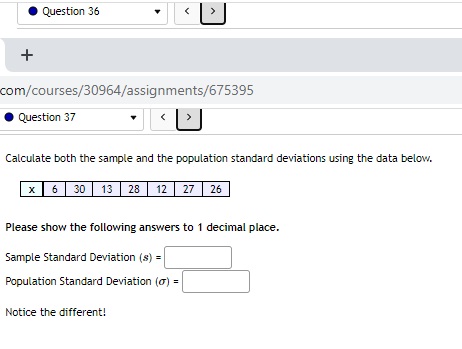
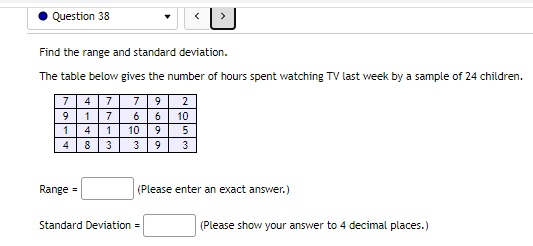
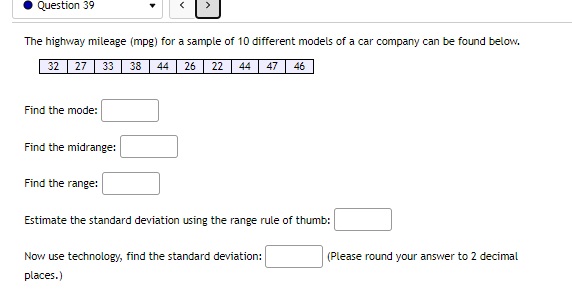
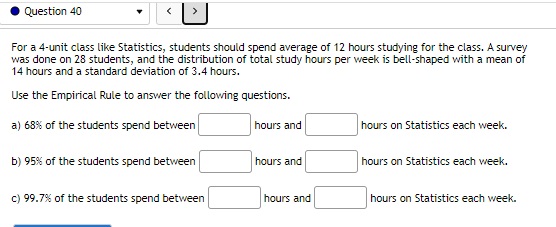
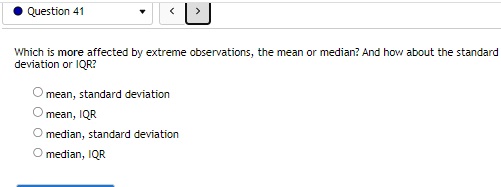
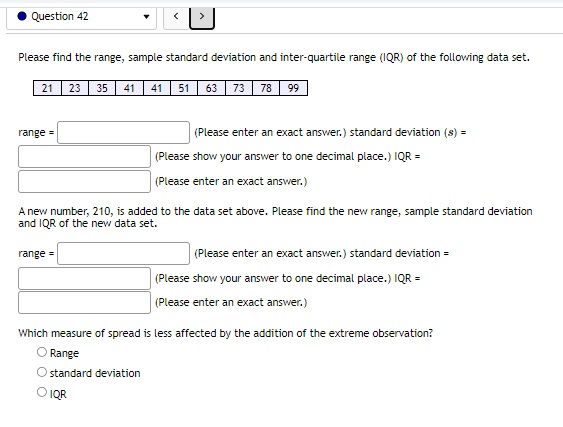
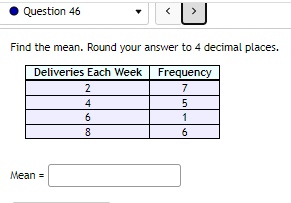
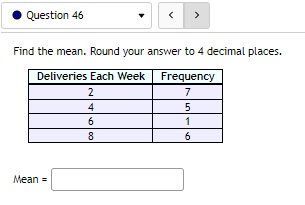
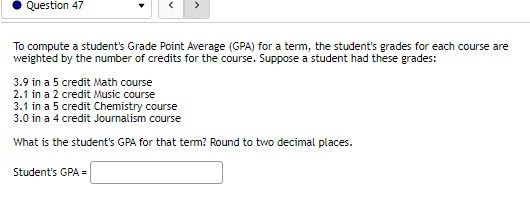
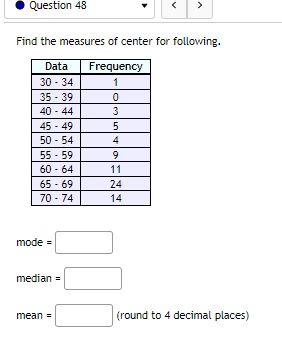
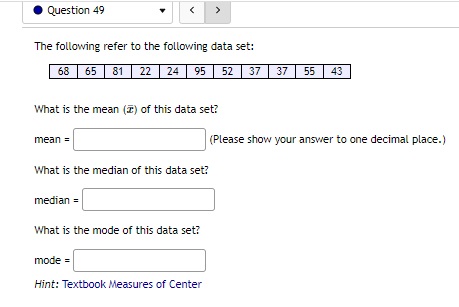
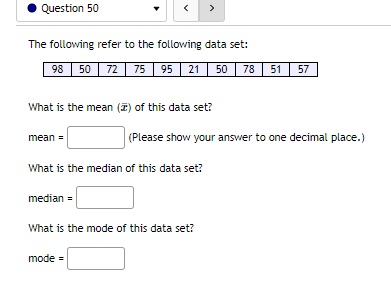
Consider the boxplot below. 33 47 63 10 20 30 40 50 60 70 80 data Q a. What quarter has the smallest spread of data? First Quarter Second Quarter Third Quarter Fourth Quarter b. What is that spread? C. Find the Inter Quartile Range (IQR): |30 d. Which interval has the most data in it? 33 - 47 O18 - 33 0 50 - 63 62 - 74 e. What value could represent the 54th percentile? 0 64 O25 35 0 50Question 30 6 8 10 12 14 16 18 Which of the following statements are true about the boxplot shown here? I. The distribution is skewed right. II. The interquartile range is about 8. Ill. The median is about 10. OI only O ll only O Ill only Ol and II O ll and IllQuestion 33 6 7 8 9 10 11 12 13 14 15 16 17 18 19 data Q Based on the boxplot above, identify the 5 number summary (min, Q1, median, Q3, max) The Inter-Quatile Range (IQR) = Q3 - Q1 =Question 34 Here is a set of sample data. 52 44 55 86 24 12 15 27 13 56 82 95 34 7 2 91 92 88 63 60 69 67 Base on the data above, identify the 5 number summaryQuestion 35 For the data shown, answer the questions. Round to 4 decimal places where possible. X 26.1 20.1 13.1 1.9 25.8 Find the mean: Find the median: Find the standard deviation:Question 36 We are going to calculate the standard deviation for the following set of sample data. 10 6 9 14 10 1) Calculate the mean. 2) Fill in the table below: Fill in the differences of each data value from the mean, then the squared differences. I- I 10 14 10 3) Calculate the sample standard deviation (s). Please round your answer to two decimal places) n - 1 Note: n is the sample size or the number of data value in the sample.Question 36 + com/courses/30964/assignments/675395 . Question 37 Calculate both the sample and the population standard deviations using the data below. X 6 30 13 |28 12 27 26 Please show the following answers to 1 decimal place. Sample Standard Deviation (s) = Population Standard Deviation (0) = Notice the different!. Question 38 Find the range and standard deviation. The table below gives the number of hours spent watching TV last week by a sample of 24 children. 7 4 2 9 1 7 6 6 10 1 4 1 10 5 4 8 3 3 3 Range = (Please enter an exact answer.) Standard Deviation = (Please show your answer to 4 decimal places.)Question 39 The highway mileage (mpg) for a sample of 10 different models of a car company can be found below, 32 27 33 38 44 26 22 44 | 47 46 Find the mode: Find the midrange: Find the range: Estimate the standard deviation using the range rule of thumb: Now use technology, find the standard deviation; (Please round your answer to 2 decimal places. )Question 40 For a 4-unit class like Statistics, students should spend average of 12 hours studying for the class. A survey was done on 28 students, and the distribution of total study hours per week is bell-shaped with a mean of 14 hours and a standard deviation of 3.4 hours. Use the Empirical Rule to answer the following questions. a) 68% of the students spend between hours and hours on Statistics each week. b) 95% of the students spend between hours and hours on Statistics each week. c) 99.7% of the students spend between hours and hours on Statistics each week.Question 41 Which is more affected by extreme observations, the mean or median? And how about the standard deviation or IQR? mean, standard deviation O mean, IQR O median, standard deviation O median, IQRQuestion 42 Please find the range, sample standard deviation and inter-quartile range (IQR) of the following data set. 21 23 35 41 41 51 63 73 78 99 range = (Please enter an exact answer.) standard deviation (s) = (Please show your answer to one decimal place.) IQR = (Please enter an exact answer.) A new number, 210, is added to the data set above. Please find the new range, sample standard deviation and IQR of the new data set. range = (Please enter an exact answer.) standard deviation = (Please show your answer to one decimal place.) IQR = (Please enter an exact answer.) Which measure of spread is less affected by the addition of the extreme observation? Range O standard deviation OIORQuestion 43 Adult men have heights with a mean of 69.0 inches and a standard deviation of 2.8 inches. Find the z-score of a man who is 76.9 inches tall. (to 4 decimal places)Question 44 On a recent quiz, the class mean was 78 with a standard deviation of 2.4. Calculate the z-score (to 4 decimal places) for a person who received score of 70. z-Score: Is this unusual? Not Unusual O UnusualQuestion 45 The heights of adult men in America are normally distributed, with a mean of 69.8 inches and a standard deviation of 2.61 inches. The heights of adult women in America are also normally distributed, but with a mean of 64.2 inches and a standard deviation of 2.56 inches. a. If a man is 6 feet 3 inches tall, what is his z-score (to 4 decimal places)? b. If a woman is 5 feet 11 inches tall, what is her z-score (to 4 decimal places)? 7 = C. Who is relatively taller? O The 5 foot 11 inch American woman O The 6 foot 3 inch American manQuestion 46 Find the mean. Round your answer to 4 decimal places. Deliveries Each Week Frequency 7 4 5 CO | CN Mean =O Question 46 Find the mean. Round your answer to 4 decimal places. Deliveries Each Week Frequency 2 7 4 5 6 Mean =Question 47 To compute a student's Grade Point Average (GPA) for a term, the student's grades for each course are weighted by the number of credits for the course. Suppose a student had these grades: 3.9 in a 5 credit Math course 2.1 in a 2 credit Music course 3.1 in a 5 credit Chemistry course 3.0 in a 4 credit Journalism course What is the student's GPA for that term? Round to two decimal places. Student's GPA =Question 48 Find the measures of center for following. Data Frequency 30 - 34 35 - 39 0 40 - 44 3 45 - 49 5 50 - 54 A 55 - 59 9 60 - 64 11 65 - 69 24 70 - 74 14 mode = median = mean = (round to 4 decimal places)Question 49 The following refer to the following data set: 68 65 81 22 |24 95 52 37 37 55 43 What is the mean () of this data set? mean = (Please show your answer to one decimal place.) What is the median of this data set? median = What is the mode of this data set? mode = Hint: Textbook Measures of CenterQuestion 50 The following refer to the following data set: 98 50 72 75 95 | 21 50 78 51 57 What is the mean (2) of this data set? mean = (Please show your answer to one decimal place.) What is the median of this data set? median = What is the mode of this data set? mode =
Step by Step Solution
There are 3 Steps involved in it

Get step-by-step solutions from verified subject matter experts