

Question: Consider the control chart below. R-chart I 2 3 45 6 789101112131415 Sample Q Is this process in statistical control? O No. There is at
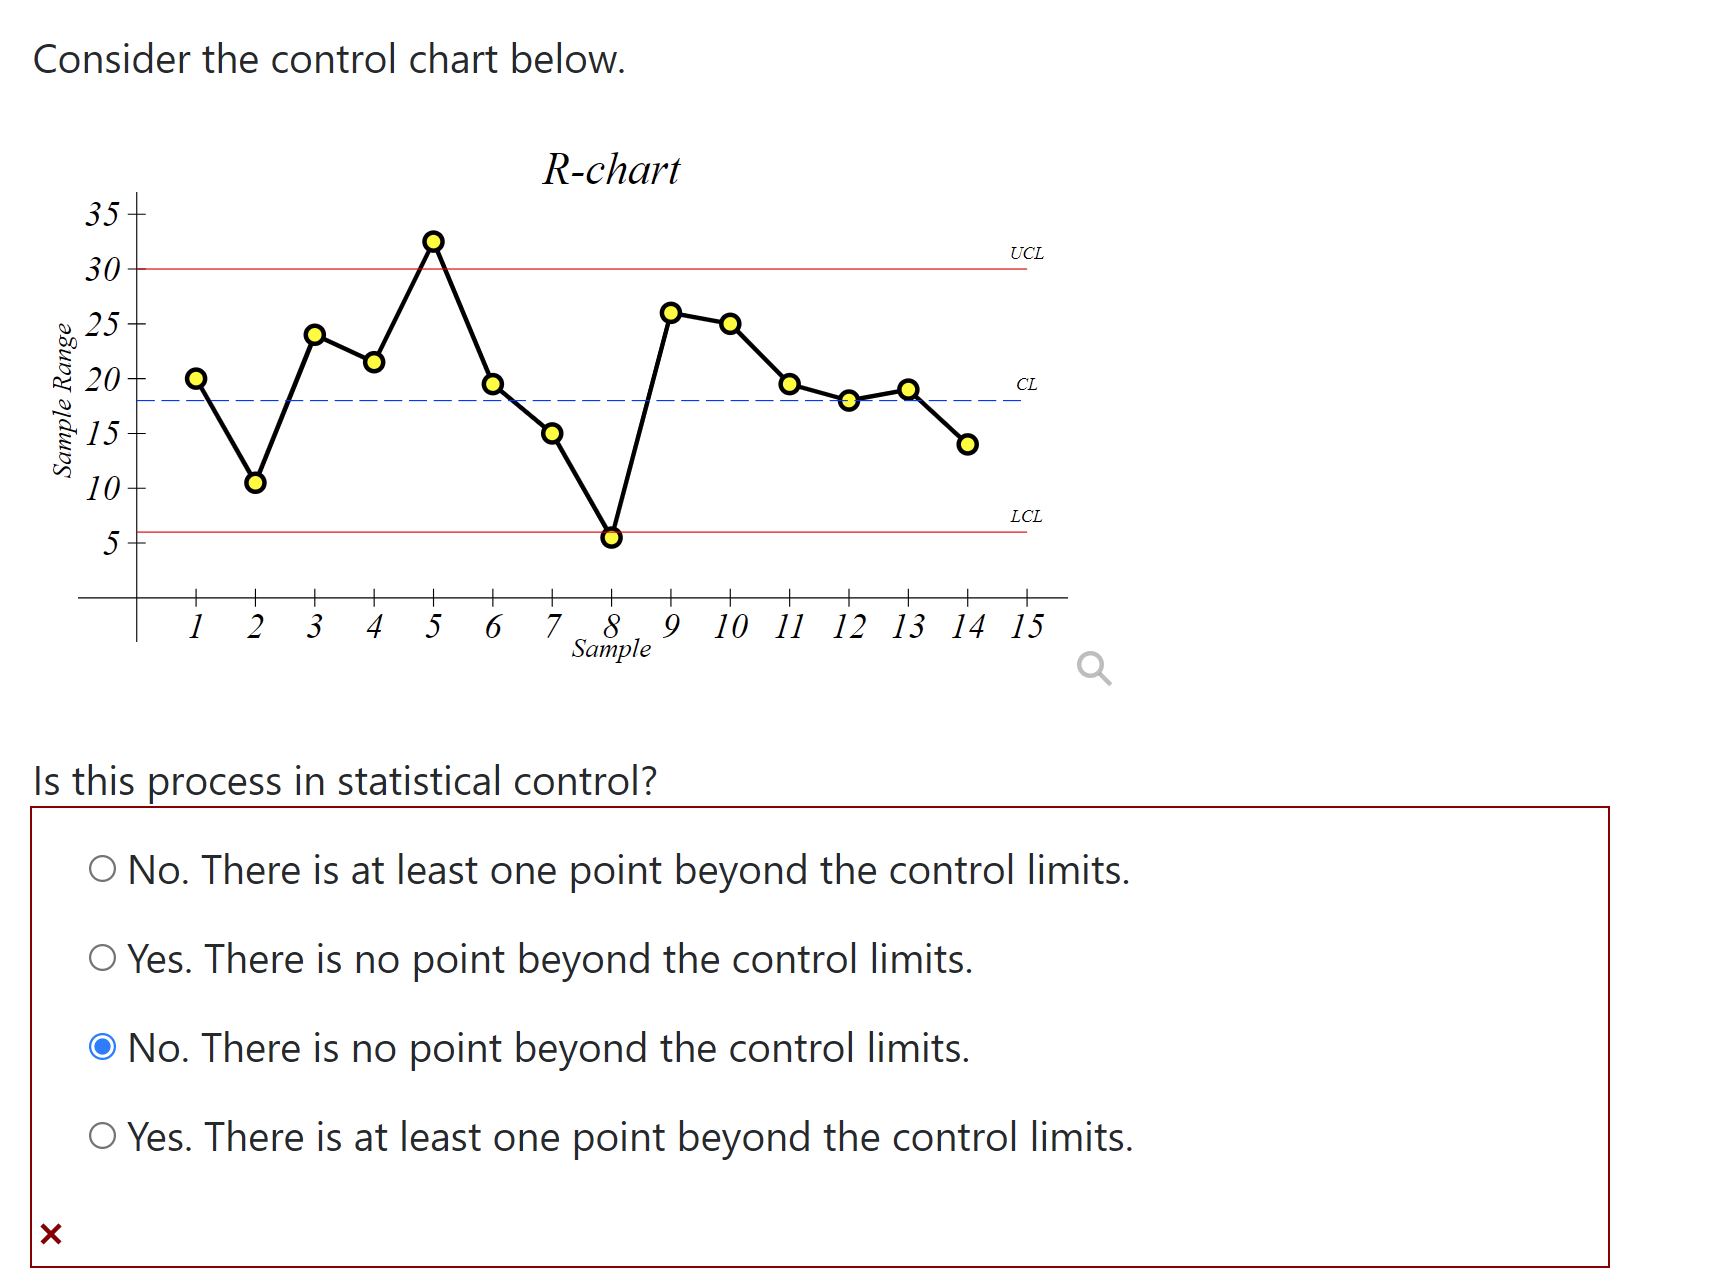
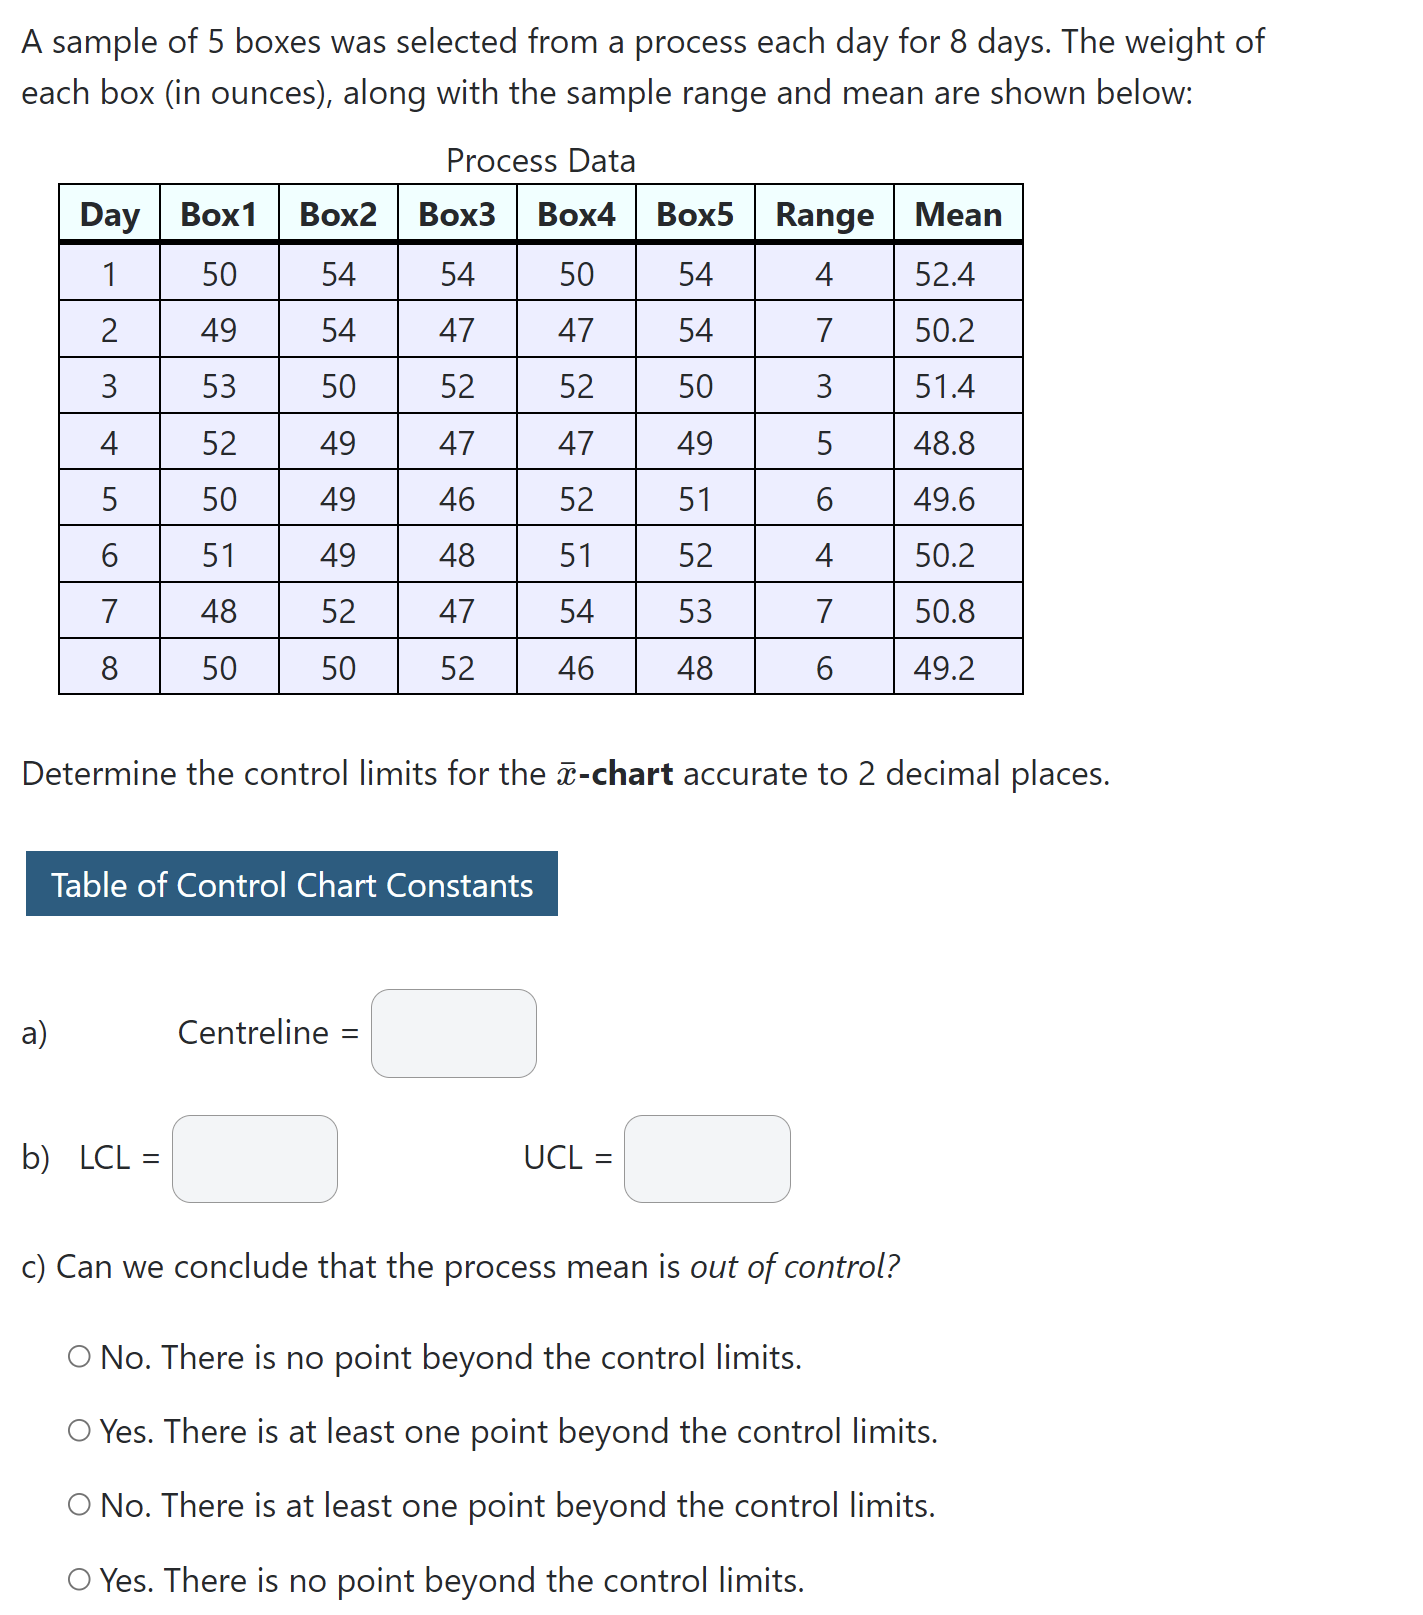
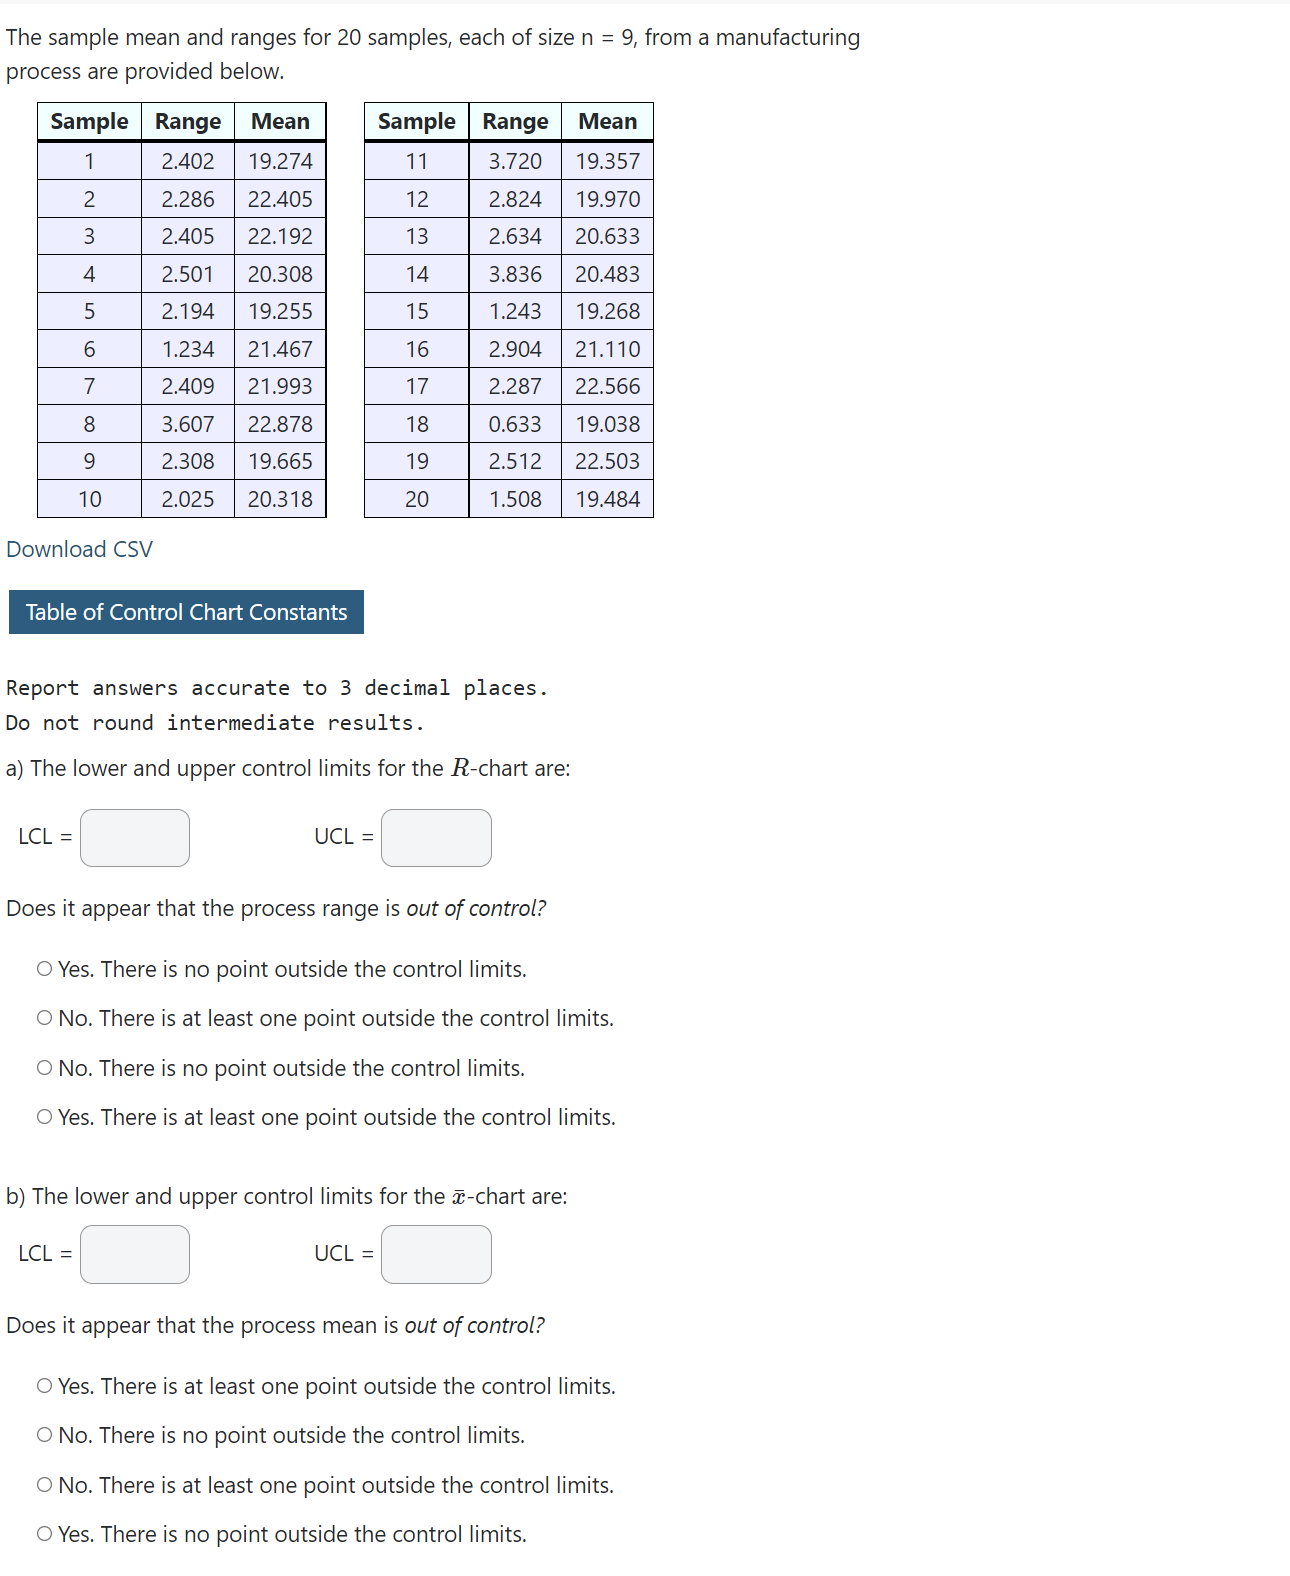
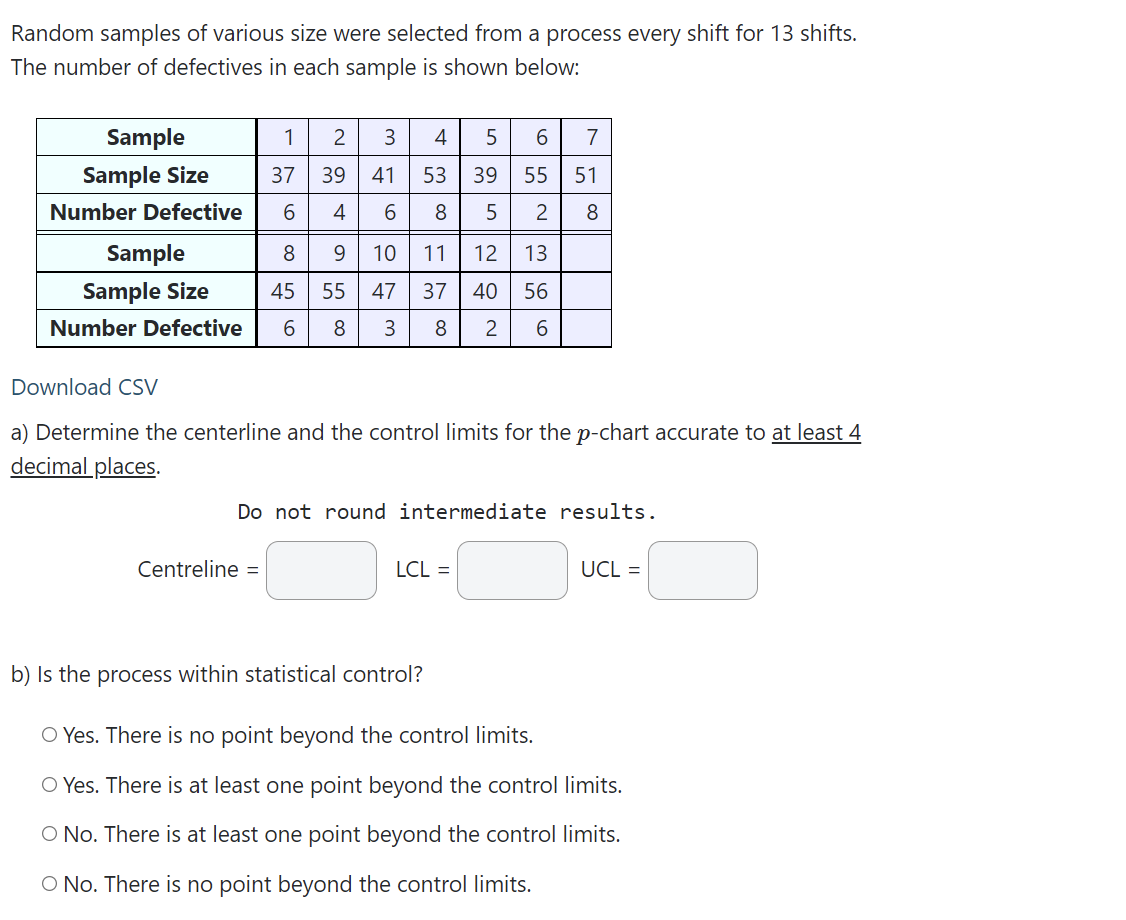


Consider the control chart below. R-chart I 2 3 45 6 789101112131415 Sample Q Is this process in statistical control? O No. There is at least one point beyond the control limits. 0 Yes. There is no point beyond the control limits. (O) No. There is no point beyond the control limits. 0 Yes. There is at least one point beyond the control limits. A sample of 5 boxes was selected from a process each day for 8 days. The weight of each box (in ounces), along with the sample range and mean are shown below: Process Data Day Box 1 Box2 Box3 Box4 Box5 Range Mean 1 50 54 54 50 54 4 52.4 2 49 54 47 47 54 7 50.2 3 53 50 52 52 50 3 51.4 4 52 49 47 47 49 5 48.8 5 50 49 46 52 51 6 49.6 6 51 49 48 51 52 4 50.2 7 48 52 47 54 53 7 50.8 8 50 50 52 46 48 6 49.2 Determine the control limits for the a-chart accurate to 2 decimal places. Table of Control Chart Constants a ) Centreline = b) LCL = UCL = c) Can we conclude that the process mean is out of control? O No. There is no point beyond the control limits. O Yes. There is at least one point beyond the control limits. O No. There is at least one point beyond the control limits. O Yes. There is no point beyond the control limits.The sample mean and ranges for 20 samples, each of size n = 9, from a manufacturing process are provided below. Sample Range Mean Sample Range Mean 1 2.402 19.274 11 3.720 19.357 2 2.286 22.405 12 2.824 19.970 3 2.405 22.192 13 2.634 20.633 4 2.501 20.308 14 3.836 20.483 5 2.194 19.255 15 1.243 19.268 6 1.234 21.467 16 2.904 21.110 7 2.409 21.993 17 2.287 22.566 8 3.607 22.878 18 0.633 19.038 9 2.308 19.665 19 2.512 22.503 10 2.025 20.318 20 1.508 19.484 Download CSV Table of Control Chart Constants Report answers accurate to 3 decimal places. Do not round intermediate results. a) The lower and upper control limits for the R-chart are: m@ M3 Does it appear that the process range is out of control? 0 Yes. There is no point outside the control limits. 0 No. There is at least one point outside the control limits. 0 No. There is no point outside the control limits. 0 Yes. There is at least one point outside the control limits. b) The lower and upper control limits for the :E-chart are: mi: wCi Does it appear that the process mean is out of control? 0 Yes. There is at least one point outside the control limits. 0 No. There is no point outside the control limits. 0 No. There is at least one point outside the control limits. 0 Yes. There is no point outside the control limits. Random samples of various size were selected from a process every shift for 13 shifts. The number of defectives in each sample is shown below: Sample 1234567 Sample Size 37 39 41 53 39 55 51 Number Defective 6 4 6 8 5 2 8 Sample Sample Size Number Defective Download CSV a} Determine the centerline and the control limits for the p-chart accurate to at least 4 decimal places. Do not r'ound intermediate results. b) Is the process within statistical control? 0 Yes. There is no point beyond the control limits. 0 Yes. There is at least one point beyond the control limits. 0 No. There is at least one point beyond the control limits. 0 No. There is no point beyond the control limits
Step by Step Solution
There are 3 Steps involved in it

Get step-by-step solutions from verified subject matter experts