

Question: Consider the data for example Well Elf - 2 , given in Table 1 2 . 3 . What are the most likely flow regimes
Consider the data for example Well Elf given in Table What are the most likely flow regimes that appear on the diagnostic plot Figa before and after earlylinear flow? Does the test include any possible data from the earlyradial flow regime? From the latepseudoradial flow regime? From the latelinear flow regime? If the answer to any of these questions is "yes," analyze the
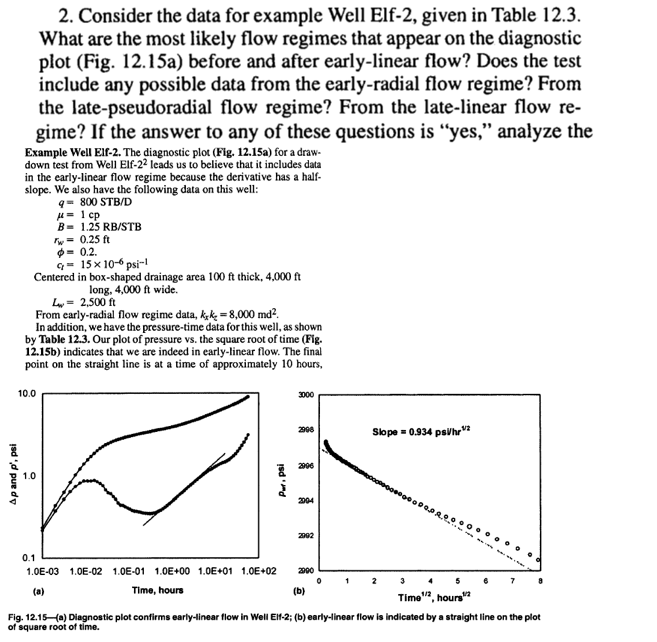
Example Well Elf The diagnostic plot Figa for a drawdown test from Well Elf leads us to believe that it includes data in the earlylinear flow regime because the derivative has a halfslope. We also have the following data on this well:
Centered in boxshaped drainage area thick,
long, wide.
From earlyradial flow regime data,
In addition, we have the pressuretime data for this well, as shown by Table Our plot of pressure vs the square root of time Figb indicates that we are indeed in earlylinear flow. The final point on the straight line is at a time of approximately hours,
of square root of time.
Step by Step Solution
There are 3 Steps involved in it
1 Expert Approved Answer
Step: 1 Unlock

Question Has Been Solved by an Expert!
Get step-by-step solutions from verified subject matter experts
Step: 2 Unlock
Step: 3 Unlock