

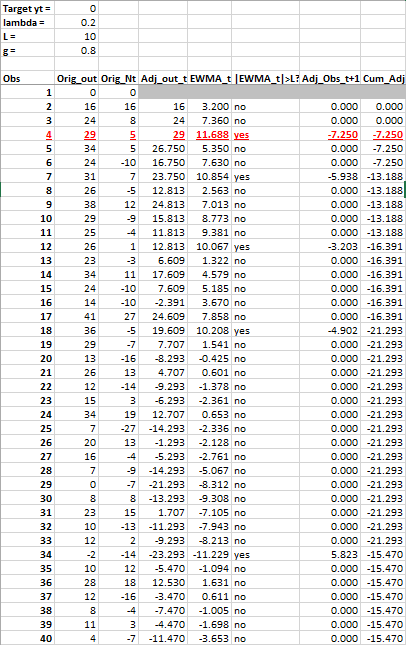
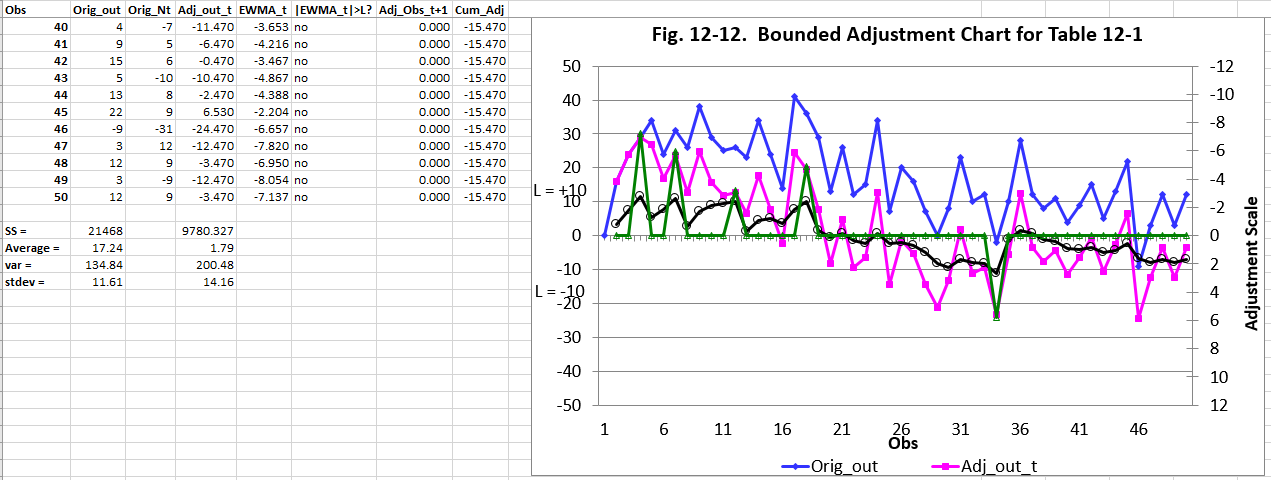
Question: Consider the data in Table 12.1. Construct a bounded adjustment chart using lambda=0.4 and L=10. Compare the performance of this chart to the one in
Consider the data in Table 12.1. Construct a bounded adjustment chart using lambda=0.4 and L=10. Compare the performance of this chart to the one in Table 12.1 and Figure 12.12. Use Excel as I showed you in the lecture.
Step by Step Solution
There are 3 Steps involved in it
1 Expert Approved Answer
Step: 1 Unlock

Question Has Been Solved by an Expert!
Get step-by-step solutions from verified subject matter experts
Step: 2 Unlock
Step: 3 Unlock