

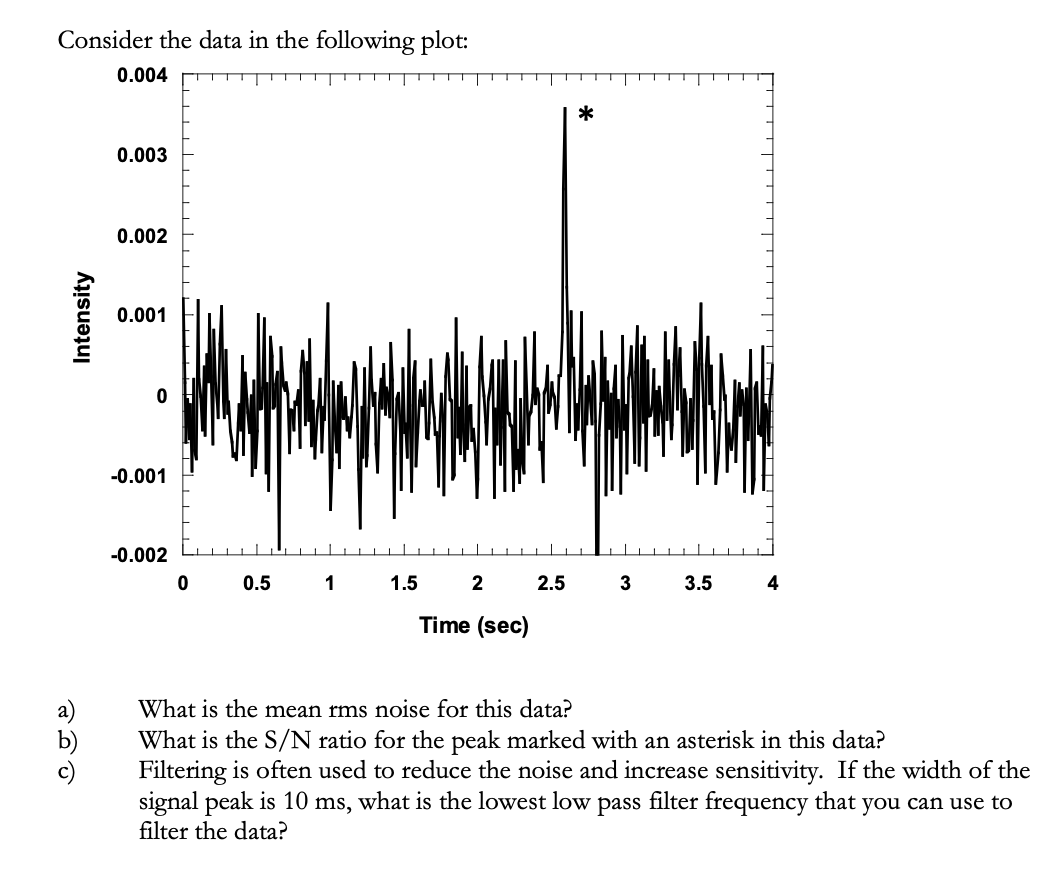
Question: Consider the data in the following plot: a) What is the mean rms noise for this data? b) What is the (S)/(N) ratio for the
Consider the data in the following plot:\ a) What is the mean rms noise for this data?\ b) What is the
(S)/(N)ratio for the peak marked with an asterisk in this data?\ c) Filtering is often used to reduce the noise and increase sensitivity. If the width of the\ signal peak is
10ms, what is the lowest low pass filter frequency that you can use to\ filter the data?
Consider the data in the following blot: a) What is the mean rms noise for this data? b) What is the S/N ratio for the peak marked with an asterisk in this data? c) Filtering is often used to reduce the noise and increase sensitivity. If the width of the signal peak is 10ms, what is the lowest low pass filter frequency that you can use to filter the data? Consider the data in the following blot: a) What is the mean rms noise for this data? b) What is the S/N ratio for the peak marked with an asterisk in this data? c) Filtering is often used to reduce the noise and increase sensitivity. If the width of the signal peak is 10ms, what is the lowest low pass filter frequency that you can use to filter the data
Step by Step Solution
There are 3 Steps involved in it

Get step-by-step solutions from verified subject matter experts