

Question: Consider the data in the following table. Observed values Forecast 1 Forecast 2 310 360 335 375 350 425 450 400 475 520 545 595
- Consider the data in the following table.
| Observed values | Forecast 1 | Forecast 2 |
| 310 | 360 | 335 |
| 375 | 350 | 425 |
| 450 | 400 | 475 |
| 520 | 545 | 595 |
Which forecast is better? Justify your answer.
- The following graph shows part of observed time series demand and two different moving average forecasts (labeled as x and y).
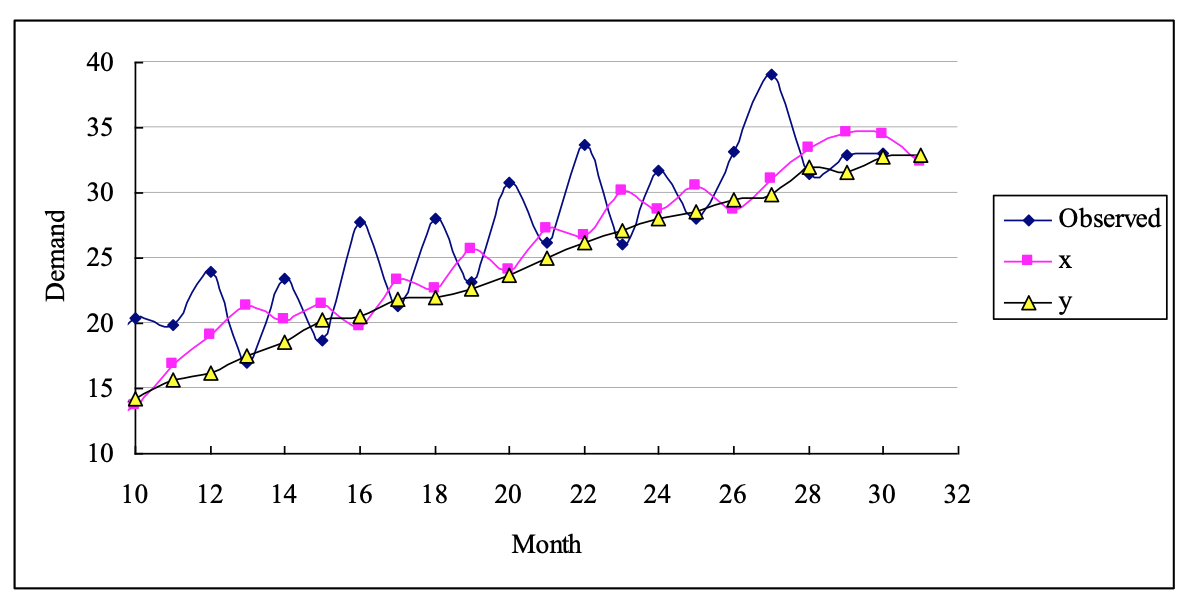
Which forecast uses a longer moving average period? Why? Which forecast is better? Based on the graph, what may be the reason for one forecast being better than the other for this set of data?
- The technology is available for increasing the airplane speed such that the cross-Pacific travel (say, from Japan to the U.S.) can be cut short by two hours. Design a survey study to find out the costumers willingness for this new service.
Step by Step Solution
There are 3 Steps involved in it
1 Expert Approved Answer
Step: 1 Unlock

Question Has Been Solved by an Expert!
Get step-by-step solutions from verified subject matter experts
Step: 2 Unlock
Step: 3 Unlock