

Question: Consider the data in the table below. l. [n the spaoe below {or on a separate sheet of paper), plot all observations of the table
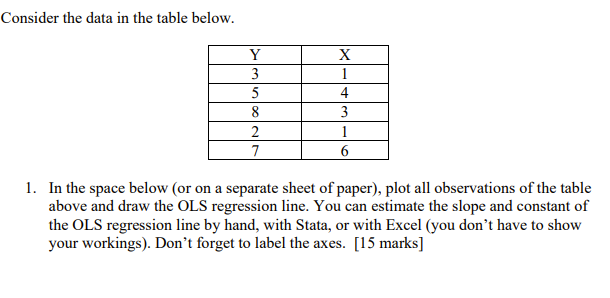


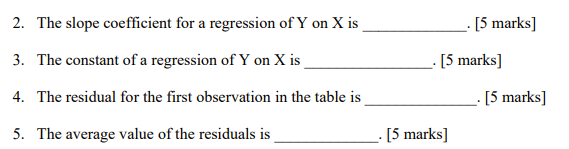
Consider the data in the table below. l. [n the spaoe below {or on a separate sheet of paper), plot all observations of the table above and draw the GL3 regression line. You can estimate the slope and constant of the DLS regression line by hand, with Stata, or with Ease] {you don't have to show your workings}. Don't forget to label the axes. [15 marks] 2. The slope coefficient for a regression of Y on X is . [5 marks] 3. The constant of a regression of Y on X is [5 marks] 4. The residual for the first observation in the table is [5 marks] 5. The average value of the residuals is [5 marks]
Step by Step Solution
There are 3 Steps involved in it
1 Expert Approved Answer
Step: 1 Unlock

Question Has Been Solved by an Expert!
Get step-by-step solutions from verified subject matter experts
Step: 2 Unlock
Step: 3 Unlock