

Question: Consider the data in the table on the right showing the average life Life expectancy of expectancy of women in various years. Note that x

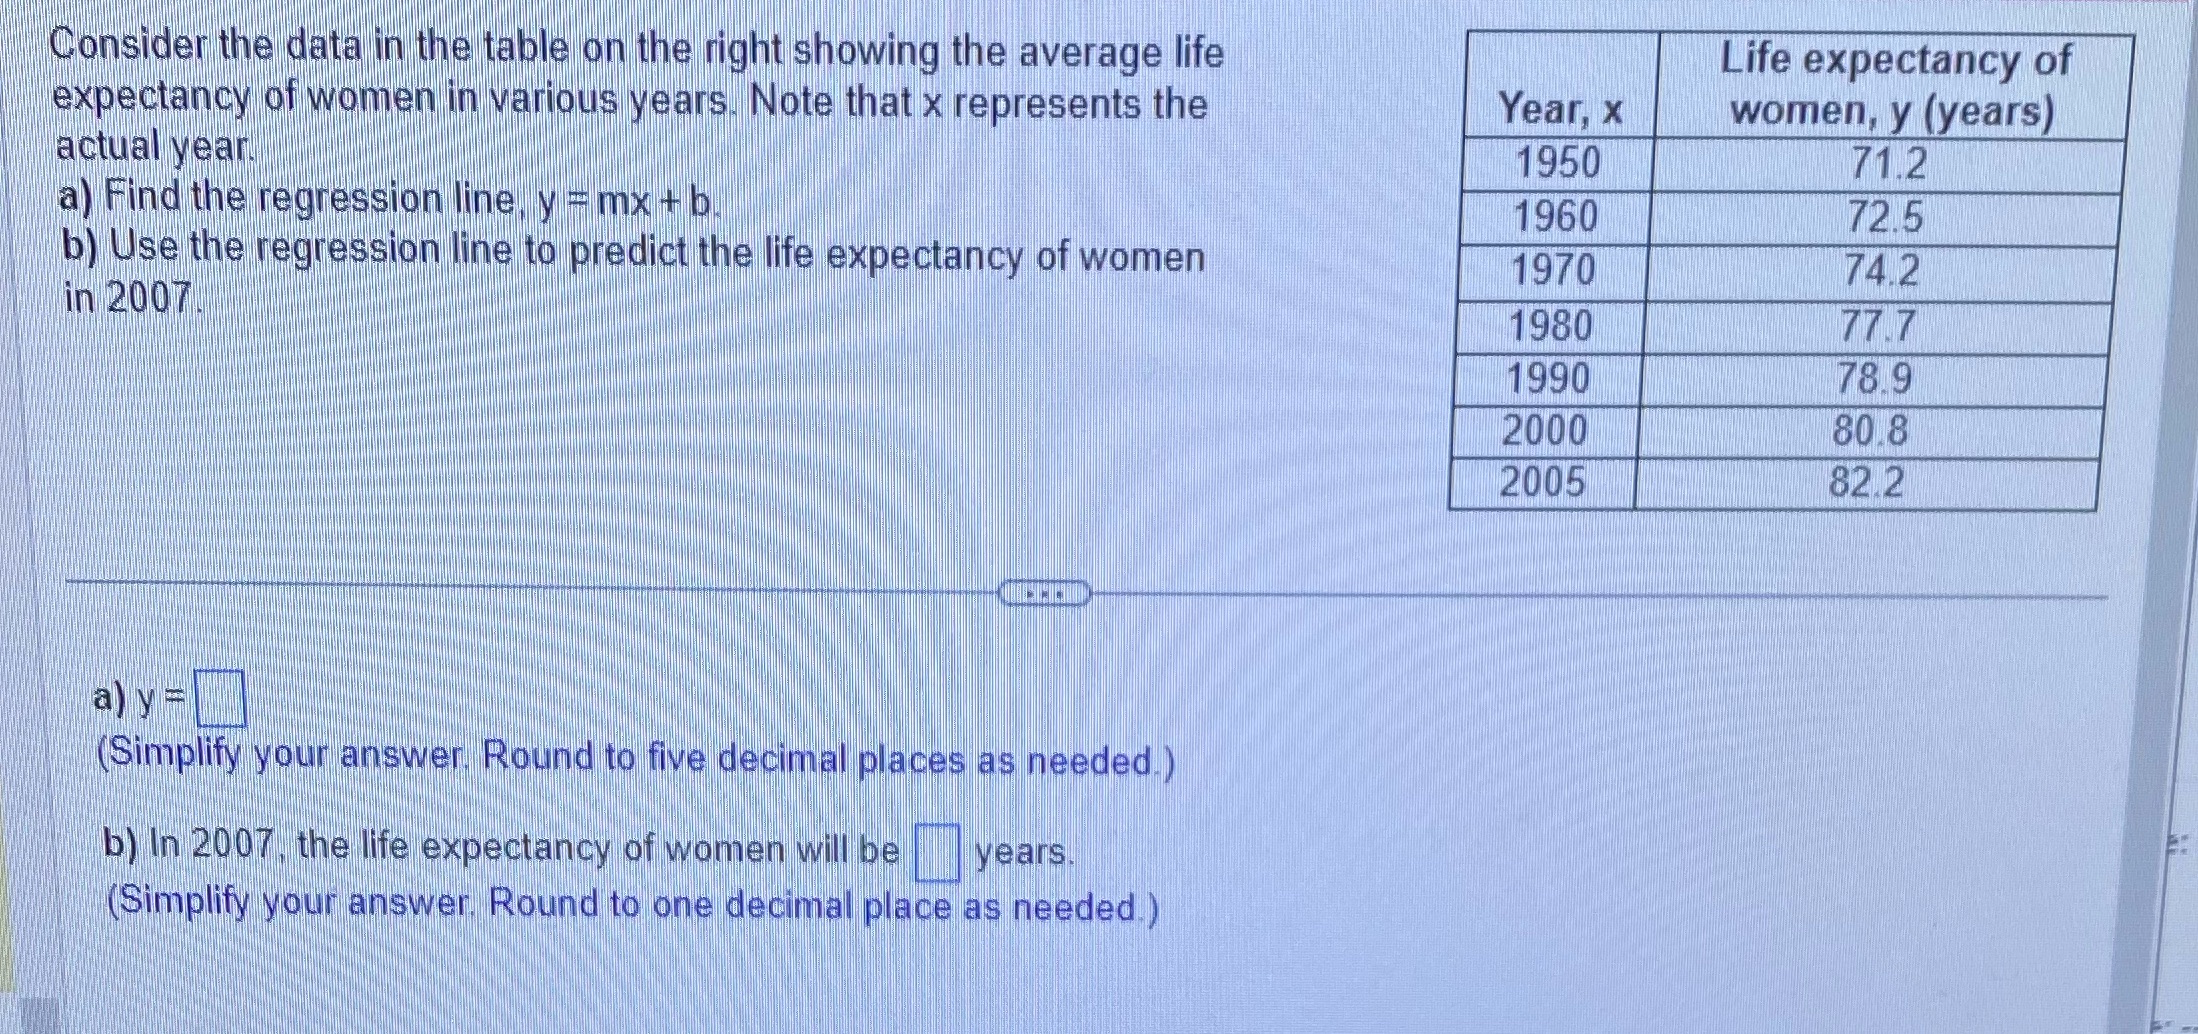
Consider the data in the table on the right showing the average life Life expectancy of expectancy of women in various years. Note that x represents the Year, x women, y (years) actual year! 1950 71.2 a) Find the regression line, y = mx + b 1960 72.5 b) Use the regression line to predict the life expectancy of women 1970 74.2 in 2007 1980 77.7 1990 78.9 2000 80.8 2005 82.2 a) y = (Simplify your answer. Round to five decimal places as needed.) b) In 2007, the life expectancy of women will be years. (Simplify your answer. Round to one decimal place as needed.)
Step by Step Solution
There are 3 Steps involved in it
1 Expert Approved Answer
Step: 1 Unlock

Question Has Been Solved by an Expert!
Get step-by-step solutions from verified subject matter experts
Step: 2 Unlock
Step: 3 Unlock