

Question: Consider the data points + y 1 5.3 1.8 2 3 -1.2 4 2.1 5 5.2 6 1.4 7 -1.6 8 2.6 9 5 and
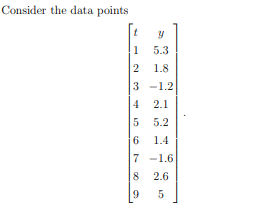
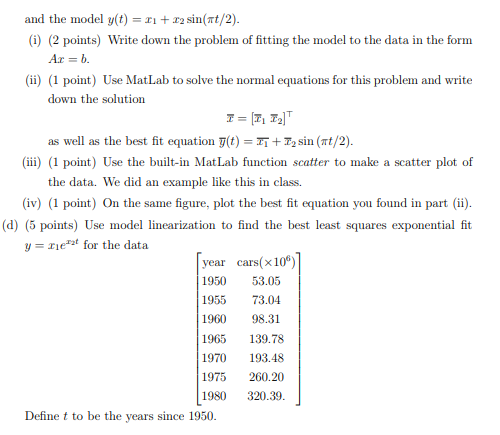
Consider the data points + y 1 5.3 1.8 2 3 -1.2 4 2.1 5 5.2 6 1.4 7 -1.6 8 2.6 9 5 and the model y(t) = 1 + = 11 + 12 sin(mt/2). (i) (2 points) Write down the problem of fitting the model to the data in the form Ac = b. (ii) (1 point) Use MatLab to solve the normal equations for this problem and write down the solution I= [773] as well as the best fit equation y(t) = IT + Eysin (at/2). (iii) (1 point) Use the built-in MatLab function scatter to make a scatter plot of the data. We did an example like this in class. (iv) (1 point) On the same figure, plot the best fit equation you found in part (ii). (d) (5 points) Use model linearization to find the best least squares exponential fit y = rent for the data year cars(x106) 1950 73.04 98.31 1965 139.78 1970 193.48 260.20 1980 320.39. Define t to be the years since 1950. 53.05 1955 1960 1975 Consider the data points + y 1 5.3 1.8 2 3 -1.2 4 2.1 5 5.2 6 1.4 7 -1.6 8 2.6 9 5 and the model y(t) = 1 + = 11 + 12 sin(mt/2). (i) (2 points) Write down the problem of fitting the model to the data in the form Ac = b. (ii) (1 point) Use MatLab to solve the normal equations for this problem and write down the solution I= [773] as well as the best fit equation y(t) = IT + Eysin (at/2). (iii) (1 point) Use the built-in MatLab function scatter to make a scatter plot of the data. We did an example like this in class. (iv) (1 point) On the same figure, plot the best fit equation you found in part (ii). (d) (5 points) Use model linearization to find the best least squares exponential fit y = rent for the data year cars(x106) 1950 73.04 98.31 1965 139.78 1970 193.48 260.20 1980 320.39. Define t to be the years since 1950. 53.05 1955 1960 1975
Step by Step Solution
There are 3 Steps involved in it

Get step-by-step solutions from verified subject matter experts