

Question: Consider the data presented in Table 1 while answering the questions posed in this problem5. a. Propose a statistical model [a probabilitg,r distribution] for modeling
![posed in this problem5. a. Propose a statistical model [a probabilitg,r distribution]](https://dsd5zvtm8ll6.cloudfront.net/si.experts.images/questions/2024/09/66ef26f8137b0_11166ef26f7e79ad.jpg)
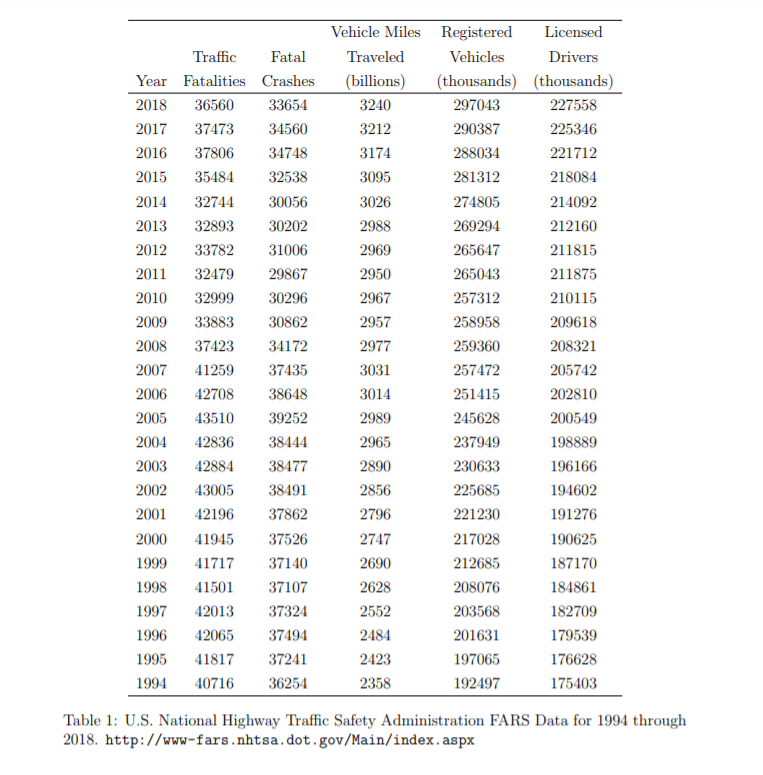
Consider the data presented in Table 1 while answering the questions posed in this problem5. a. Propose a statistical model [a probabilitg,r distribution] for modeling the number of trafc fatalities. Justifyr your recommendation using statistical reasoning. b. Estimate the average trafc fatality rate over the entire 24 years represented in this table (199-1 through 2013]. Express your estimate in units of \"tra'ic fatalities per billion vehicle miles traveled". \f\f
Step by Step Solution
There are 3 Steps involved in it
1 Expert Approved Answer
Step: 1 Unlock

Question Has Been Solved by an Expert!
Get step-by-step solutions from verified subject matter experts
Step: 2 Unlock
Step: 3 Unlock