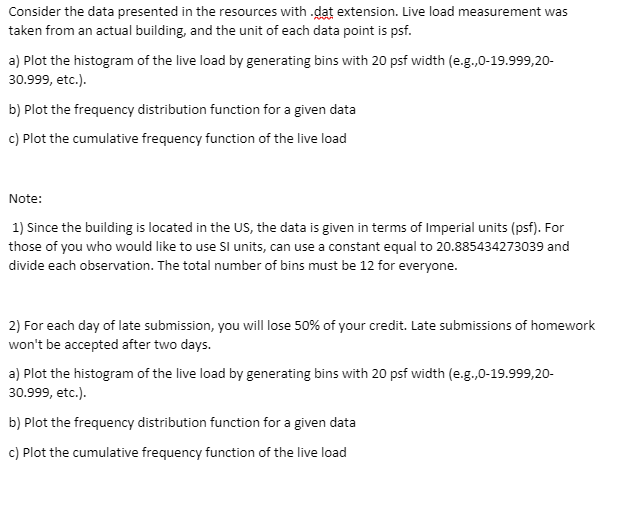
Question: Consider the data presented in the resources with .dat extension. Live load measurement was taken from an actual building, and the unit of each data

Consider the data presented in the resources with

Consider the data presented in the resources with .dat extension. Live load measurement was taken from an actual building, and the unit of each data point is psf. a) Plot the histogram of the live load by generating bins with 20 psf width (e.g., 0-19.999,20- 30.999, etc.). b) Plot the frequency distribution function for a given data C) Plot the cumulative frequency function of the live load Note: 1) Since the building is located in the US, the data is given in terms of Imperial units (psf). For those of you who would like to use SI units, can use a constant equal to 20.885434273039 and divide each observation. The total number of bins must be 12 for everyone. 2) For each day of late submission, you will lose 50% of your credit. Late submissions of homework won't be accepted after two days. a) Plot the histogram of the live load by generating bins with 20 psf width (e.g.,0-19.999,20- 30.999, etc.). b) Plot the frequency distribution function for a given data c) Plot the cumulative frequency function of the live load

Step by Step Solution

There are 3 Steps involved in it

1 Expert Approved Answer
Step: 1 Unlock blur-text-image
Question Has Been Solved by an Expert!

Get step-by-step solutions from verified subject matter experts

Step: 2 Unlock
Step: 3 Unlock

Students Have Also Explored These Related General Management Questions!