

Question: Consider the data set from question #1. a) Perform a linear regression for the graphs in #1 a) and #1 d). Plot BOTH functions on

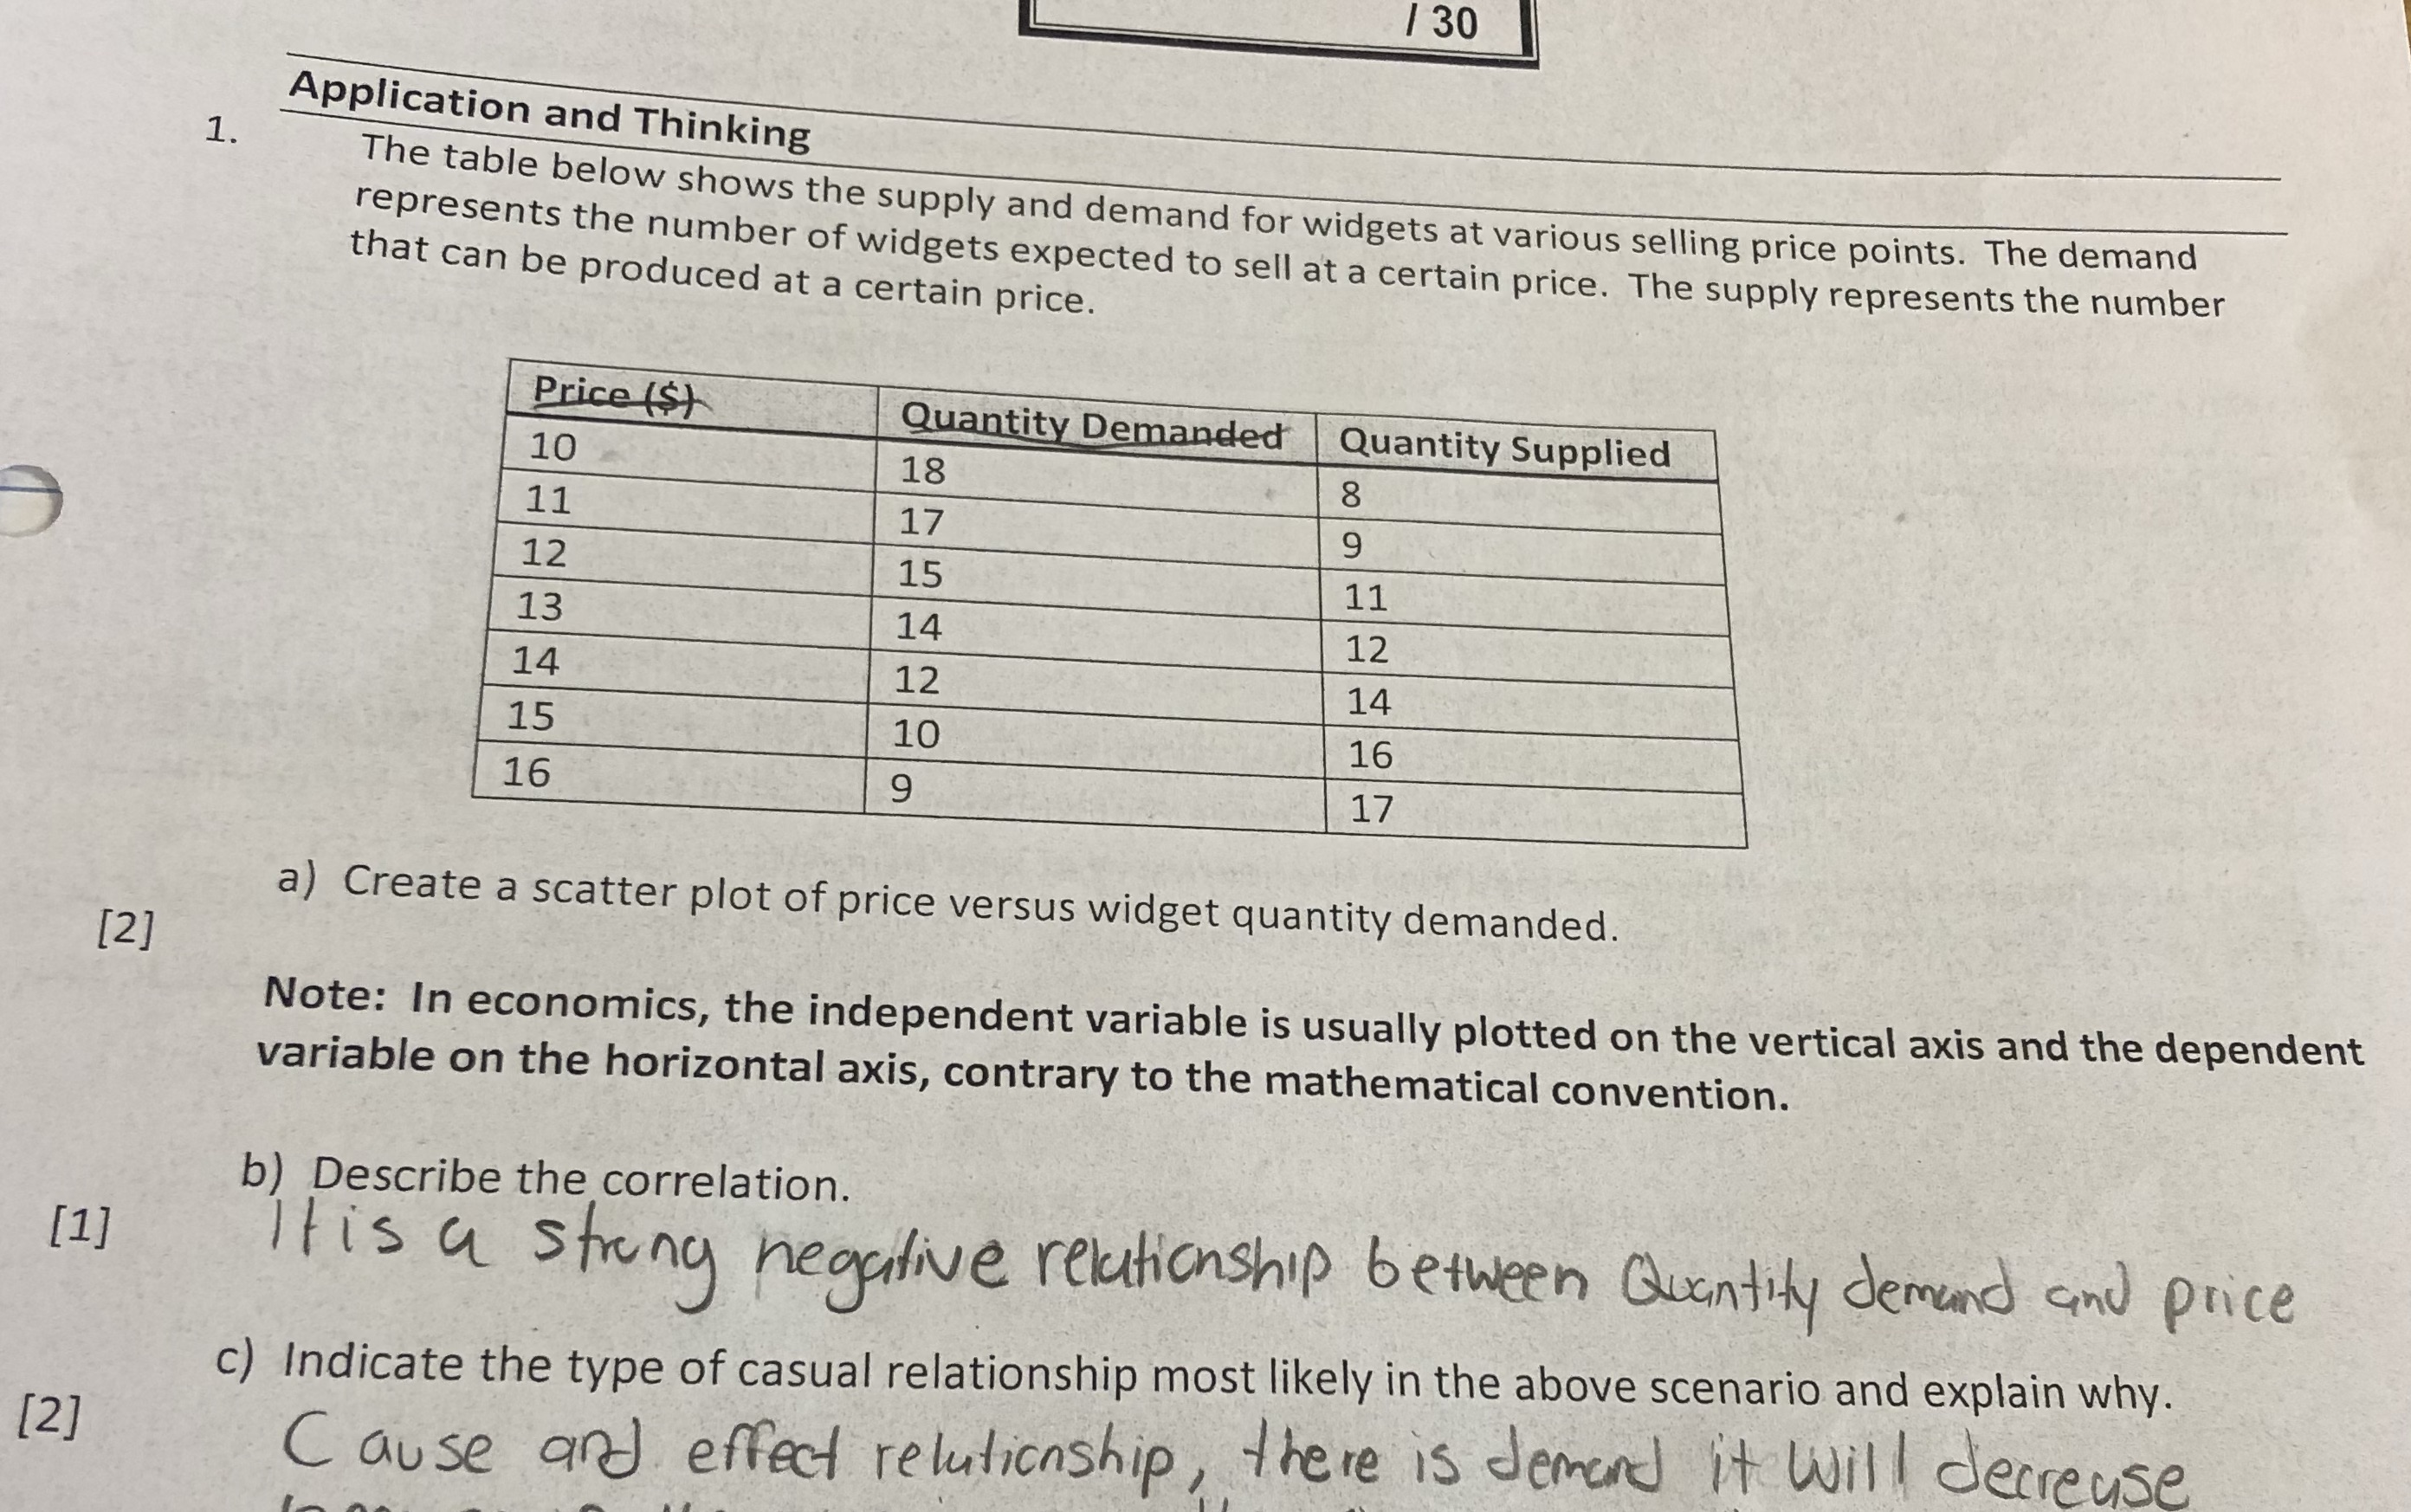
Consider the data set from question #1. a) Perform a linear regression for the graphs in #1 a) and #1 d). Plot BOTH functions on the same grid. Be sure to label the models and include the correlation coefficient for both graphs. Round values to 4 decimal places. b) Calculate the point of intersection and explain what it means in this scenario. Round the coordinates to 2 decimal places. c) What is likely to happen if the widget price is set: i) above the intersection point? ii) below the intersection point?/ 30 1. Application and Thinking The table below shows the supply and demand for widgets at various selling price points. The demand represents the number of widgets expected to sell at a certain price. The supply represents the number that can be produced at a certain price. Price ($) 10 Quantity Demanded Quantity Supplied 18 11 8 17 9 12 15 11 13 14 12 14 12 14 15 10 16 16 9 17 a) Create a scatter plot of price versus widget quantity demanded. [2] Note: In economics, the independent variable is usually plotted on the vertical axis and the dependent variable on the horizontal axis, contrary to the mathematical convention. b) Describe the correlation. [1] It is a string negative relationship between Quantity demand and price c) Indicate the type of casual relationship most likely in the above scenario and explain why. [2] Cause and effect relationship, there is demand it will decrease
Step by Step Solution
There are 3 Steps involved in it

Get step-by-step solutions from verified subject matter experts