

Question: Consider the data. X ; 1 2 3 4 5 y; 3 8 5 11 12 The estimated regression equation for these data is y
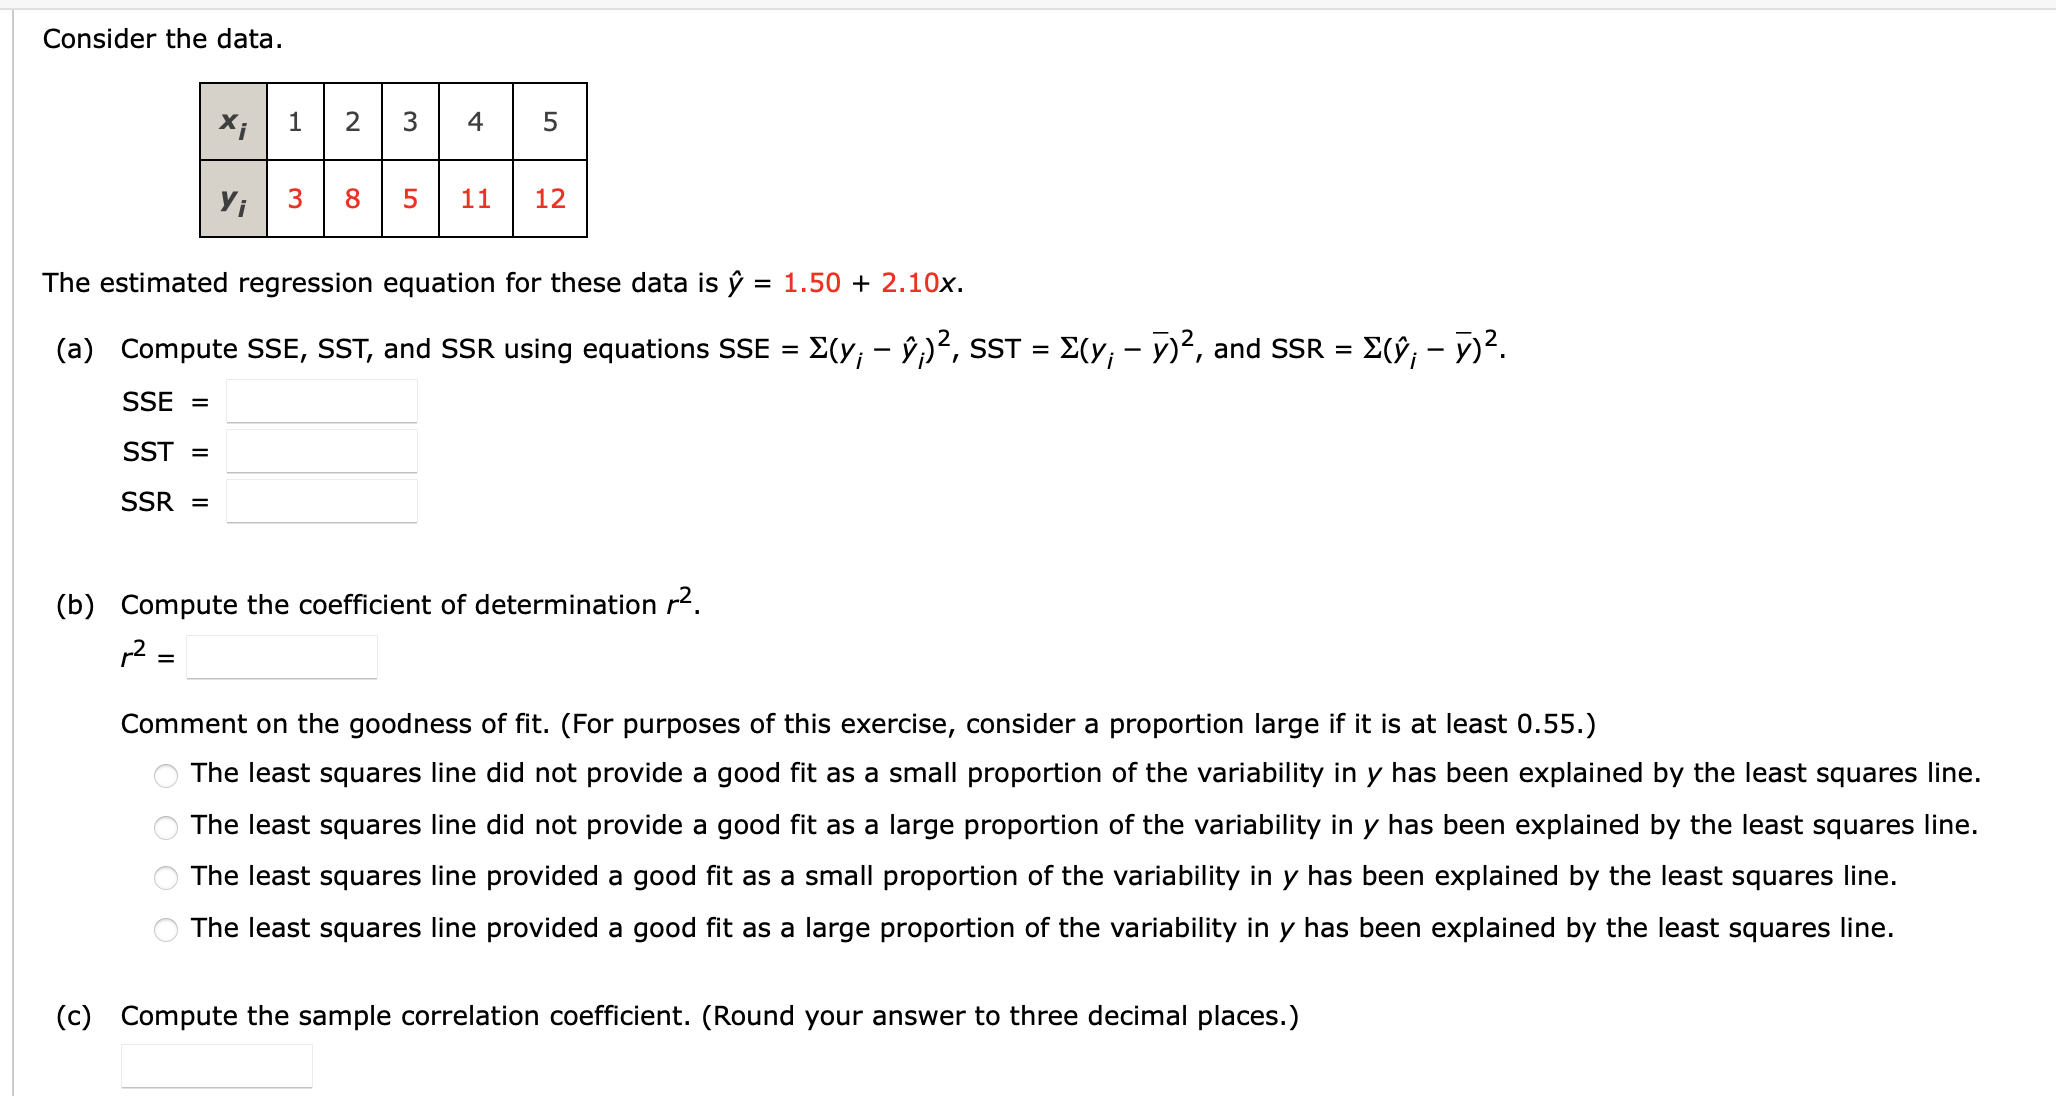
Consider the data. X ; 1 2 3 4 5 y; 3 8 5 11 12 The estimated regression equation for these data is y = 1.50 + 2.10x. (a) Compute SSE, SST, and SSR using equations SSE = Z(y; - y;) , SST = >(y; - y)2, and SSR = E(); - y)2. SSE = SST = SSR = (b) Compute the coefficient of determination 2. 12 = Comment on the goodness of fit. (For purposes of this exercise, consider a proportion large if it is at least 0.55.) The least squares line did not provide a good fit as a small proportion of the variability in y has been explained by the least squares line. The least squares line did not provide a good fit as a large proportion of the variability in y has been explained by the least squares line. The least squares line provided a good fit as a small proportion of the variability in y has been explained by the least squares line. The least squares line provided a good fit as a large proportion of the variability in y has been explained by the least squares line. (c) Compute the sample correlation coefficient. (Round your answer to three decimal places.)
Step by Step Solution
There are 3 Steps involved in it

Get step-by-step solutions from verified subject matter experts