

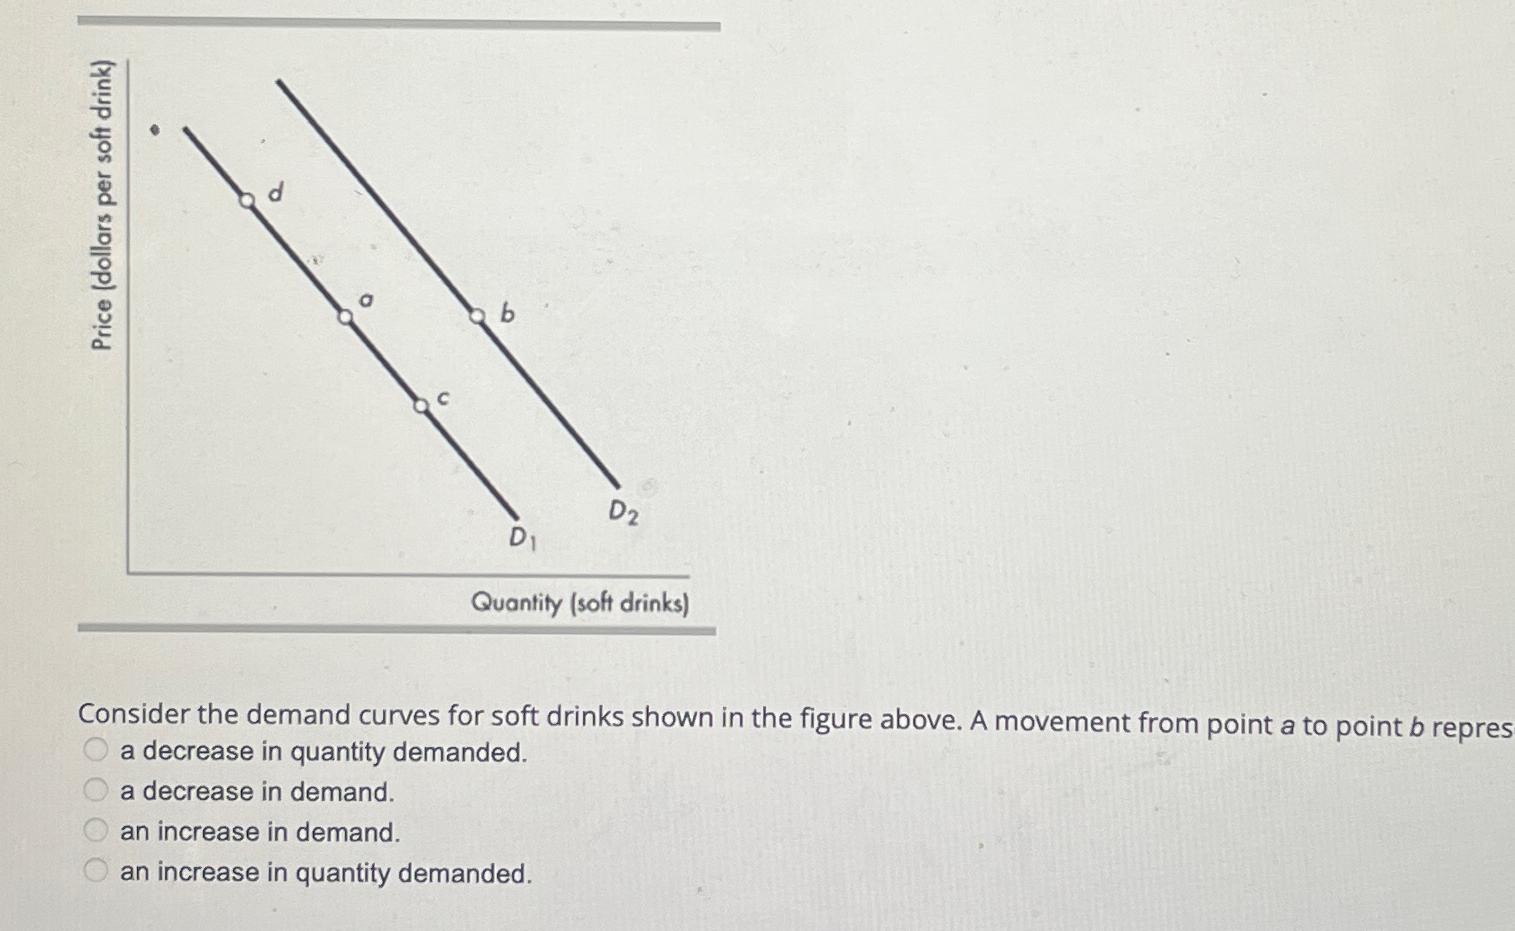
Question: Consider the demand curves for soft drinks shown in the figure above. A movement from point a to point b repres a decrease in quantity
Consider the demand curves for soft drinks shown in the figure above. A movement from point to point repres a decrease in quantity demanded.
a decrease in demand.
an increase in demand.
an increase in quantity demanded.
Step by Step Solution
There are 3 Steps involved in it
1 Expert Approved Answer
Step: 1 Unlock

Question Has Been Solved by an Expert!
Get step-by-step solutions from verified subject matter experts
Step: 2 Unlock
Step: 3 Unlock