

Question: Consider the diagram below representing the average cost ( AC ) and average variable cost ( AVC ) curves for a firm. Using the line
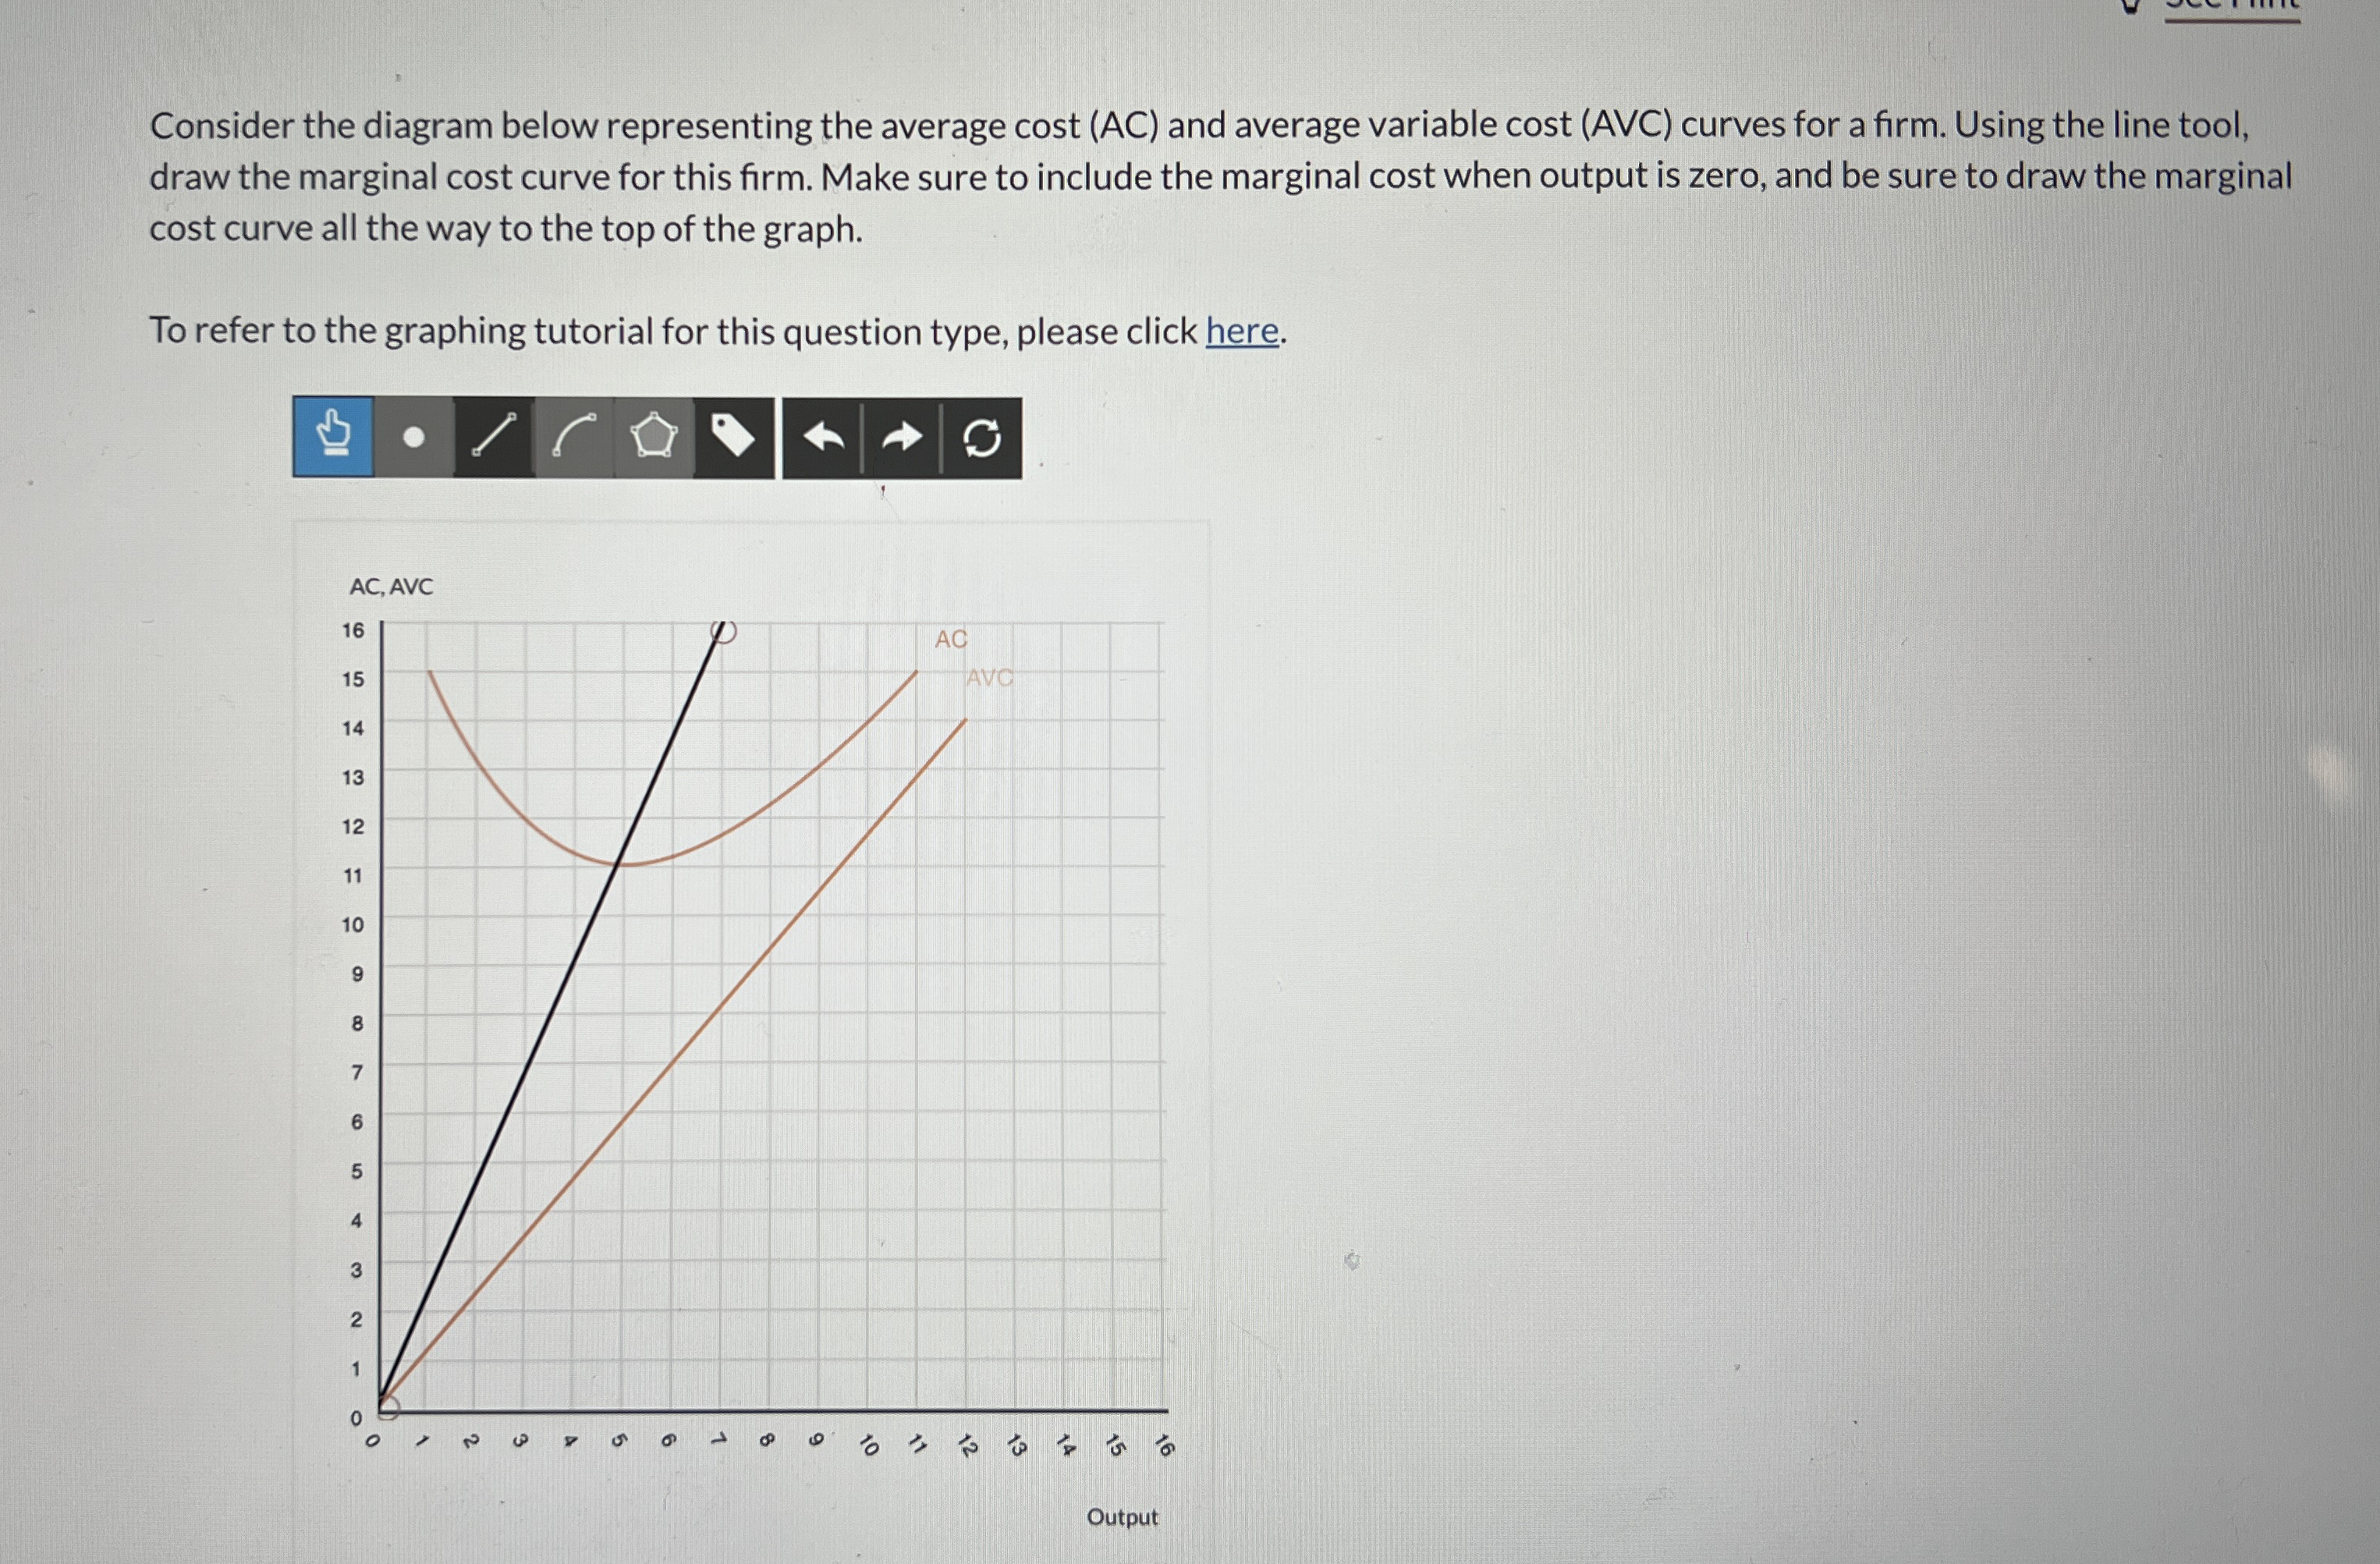
Consider the diagram below representing the average cost AC and average variable cost AVC curves for a firm. Using the line tool, draw the marginal cost curve for this firm. Make sure to include the marginal cost when output is zero, and be sure to draw the marginal cost curve all the way to the top of the graph.
To refer to the graphing tutorial for this question type, please click here.
Output
Step by Step Solution
There are 3 Steps involved in it
1 Expert Approved Answer
Step: 1 Unlock

Question Has Been Solved by an Expert!
Get step-by-step solutions from verified subject matter experts
Step: 2 Unlock
Step: 3 Unlock