

Question: Consider the distributions given by the bar graphs below. Can you simply look at the graphs to decide which of the distributions has the
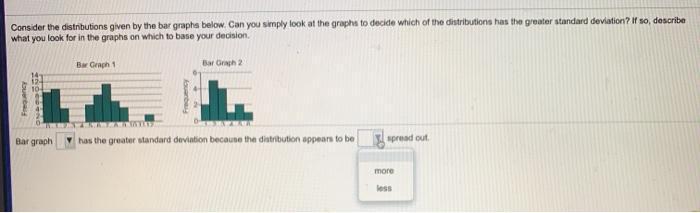
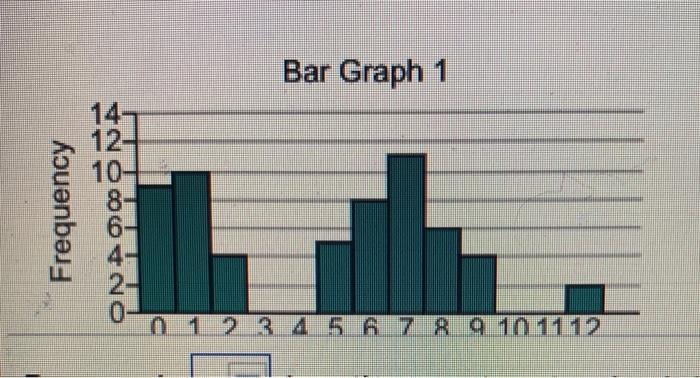
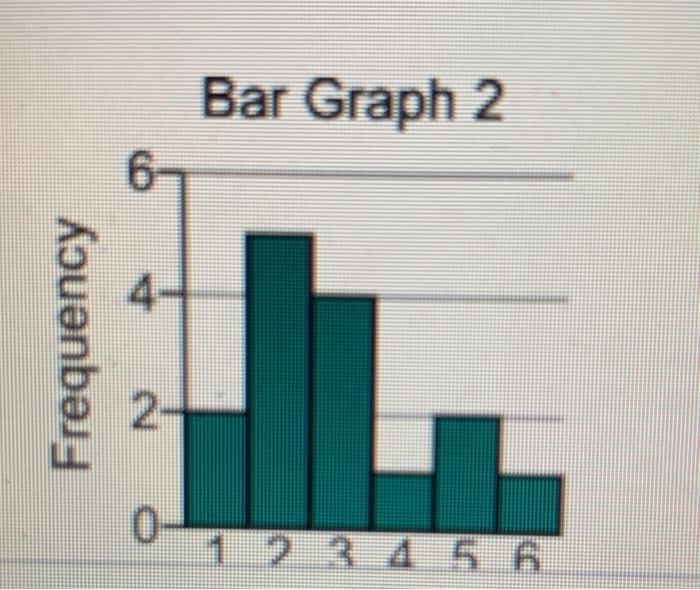
Consider the distributions given by the bar graphs below. Can you simply look at the graphs to decide which of the distributions has the greater standard deviation? If so, describe what you look for in the graphs on which to base your decision. Bar Graph 1 Bar Graph 2 10 Bar graph has the greater standard deviation becaune the distribution appears to be spread out more less fouanbay Aouerbag Bar Graph 1 14- 12 10- 0- 012345 6 78 9 101112 Frequency Bar Graph 2 6- 4- 12 345.6 Frequency 2.
Step by Step Solution
3.47 Rating (167 Votes )
There are 3 Steps involved in it
Answer Yes you can decide which distribution has the greater standard deviation by simply ... View full answer

Get step-by-step solutions from verified subject matter experts