

Question: Consider the following Basic Box & Whisker Plot. t H 10 What is the Lower Quartile (Q1) of the data set shown in the
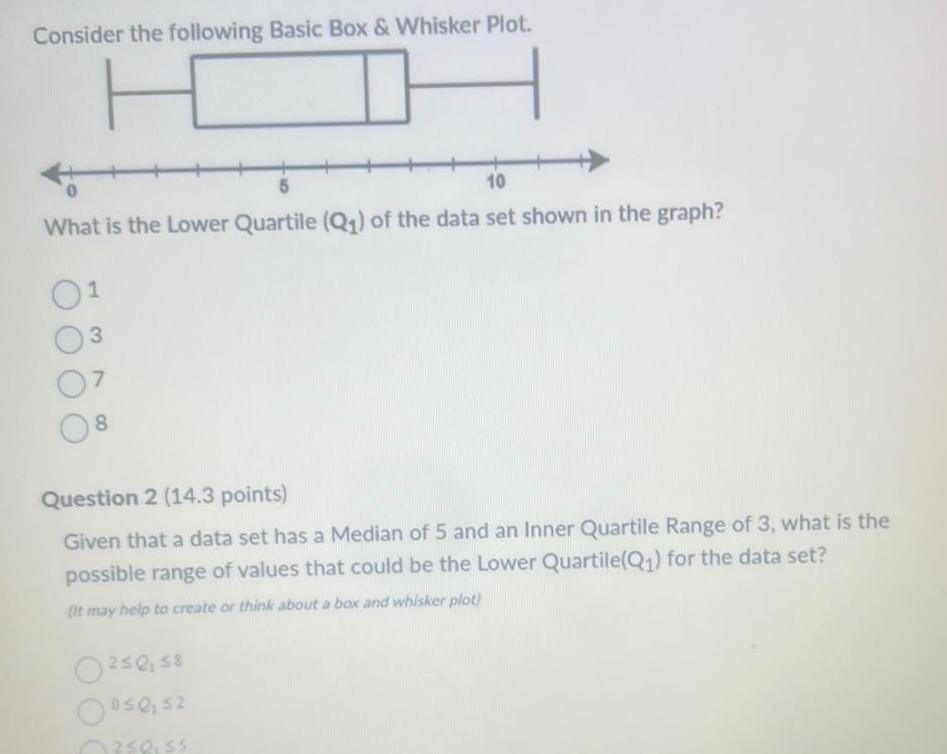
Consider the following Basic Box & Whisker Plot. t H 10 What is the Lower Quartile (Q1) of the data set shown in the graph? 1 3 8 Question 2 (14.3 points) Given that a data set has a Median of 5 and an Inner Quartile Range of 3, what is the possible range of values that could be the Lower Quartile(Q1) for the data set? (It may help to create or think about a box and whisker plot) 250,58 050, 52 250,55
Step by Step Solution
There are 3 Steps involved in it
1 Expert Approved Answer
Step: 1 Unlock

Question Has Been Solved by an Expert!
Get step-by-step solutions from verified subject matter experts
Step: 2 Unlock
Step: 3 Unlock