

Question: Consider the following block diagram as we explore the changes in signal time - domain amplitude and frequency - domain magnitude caused by decimation: We
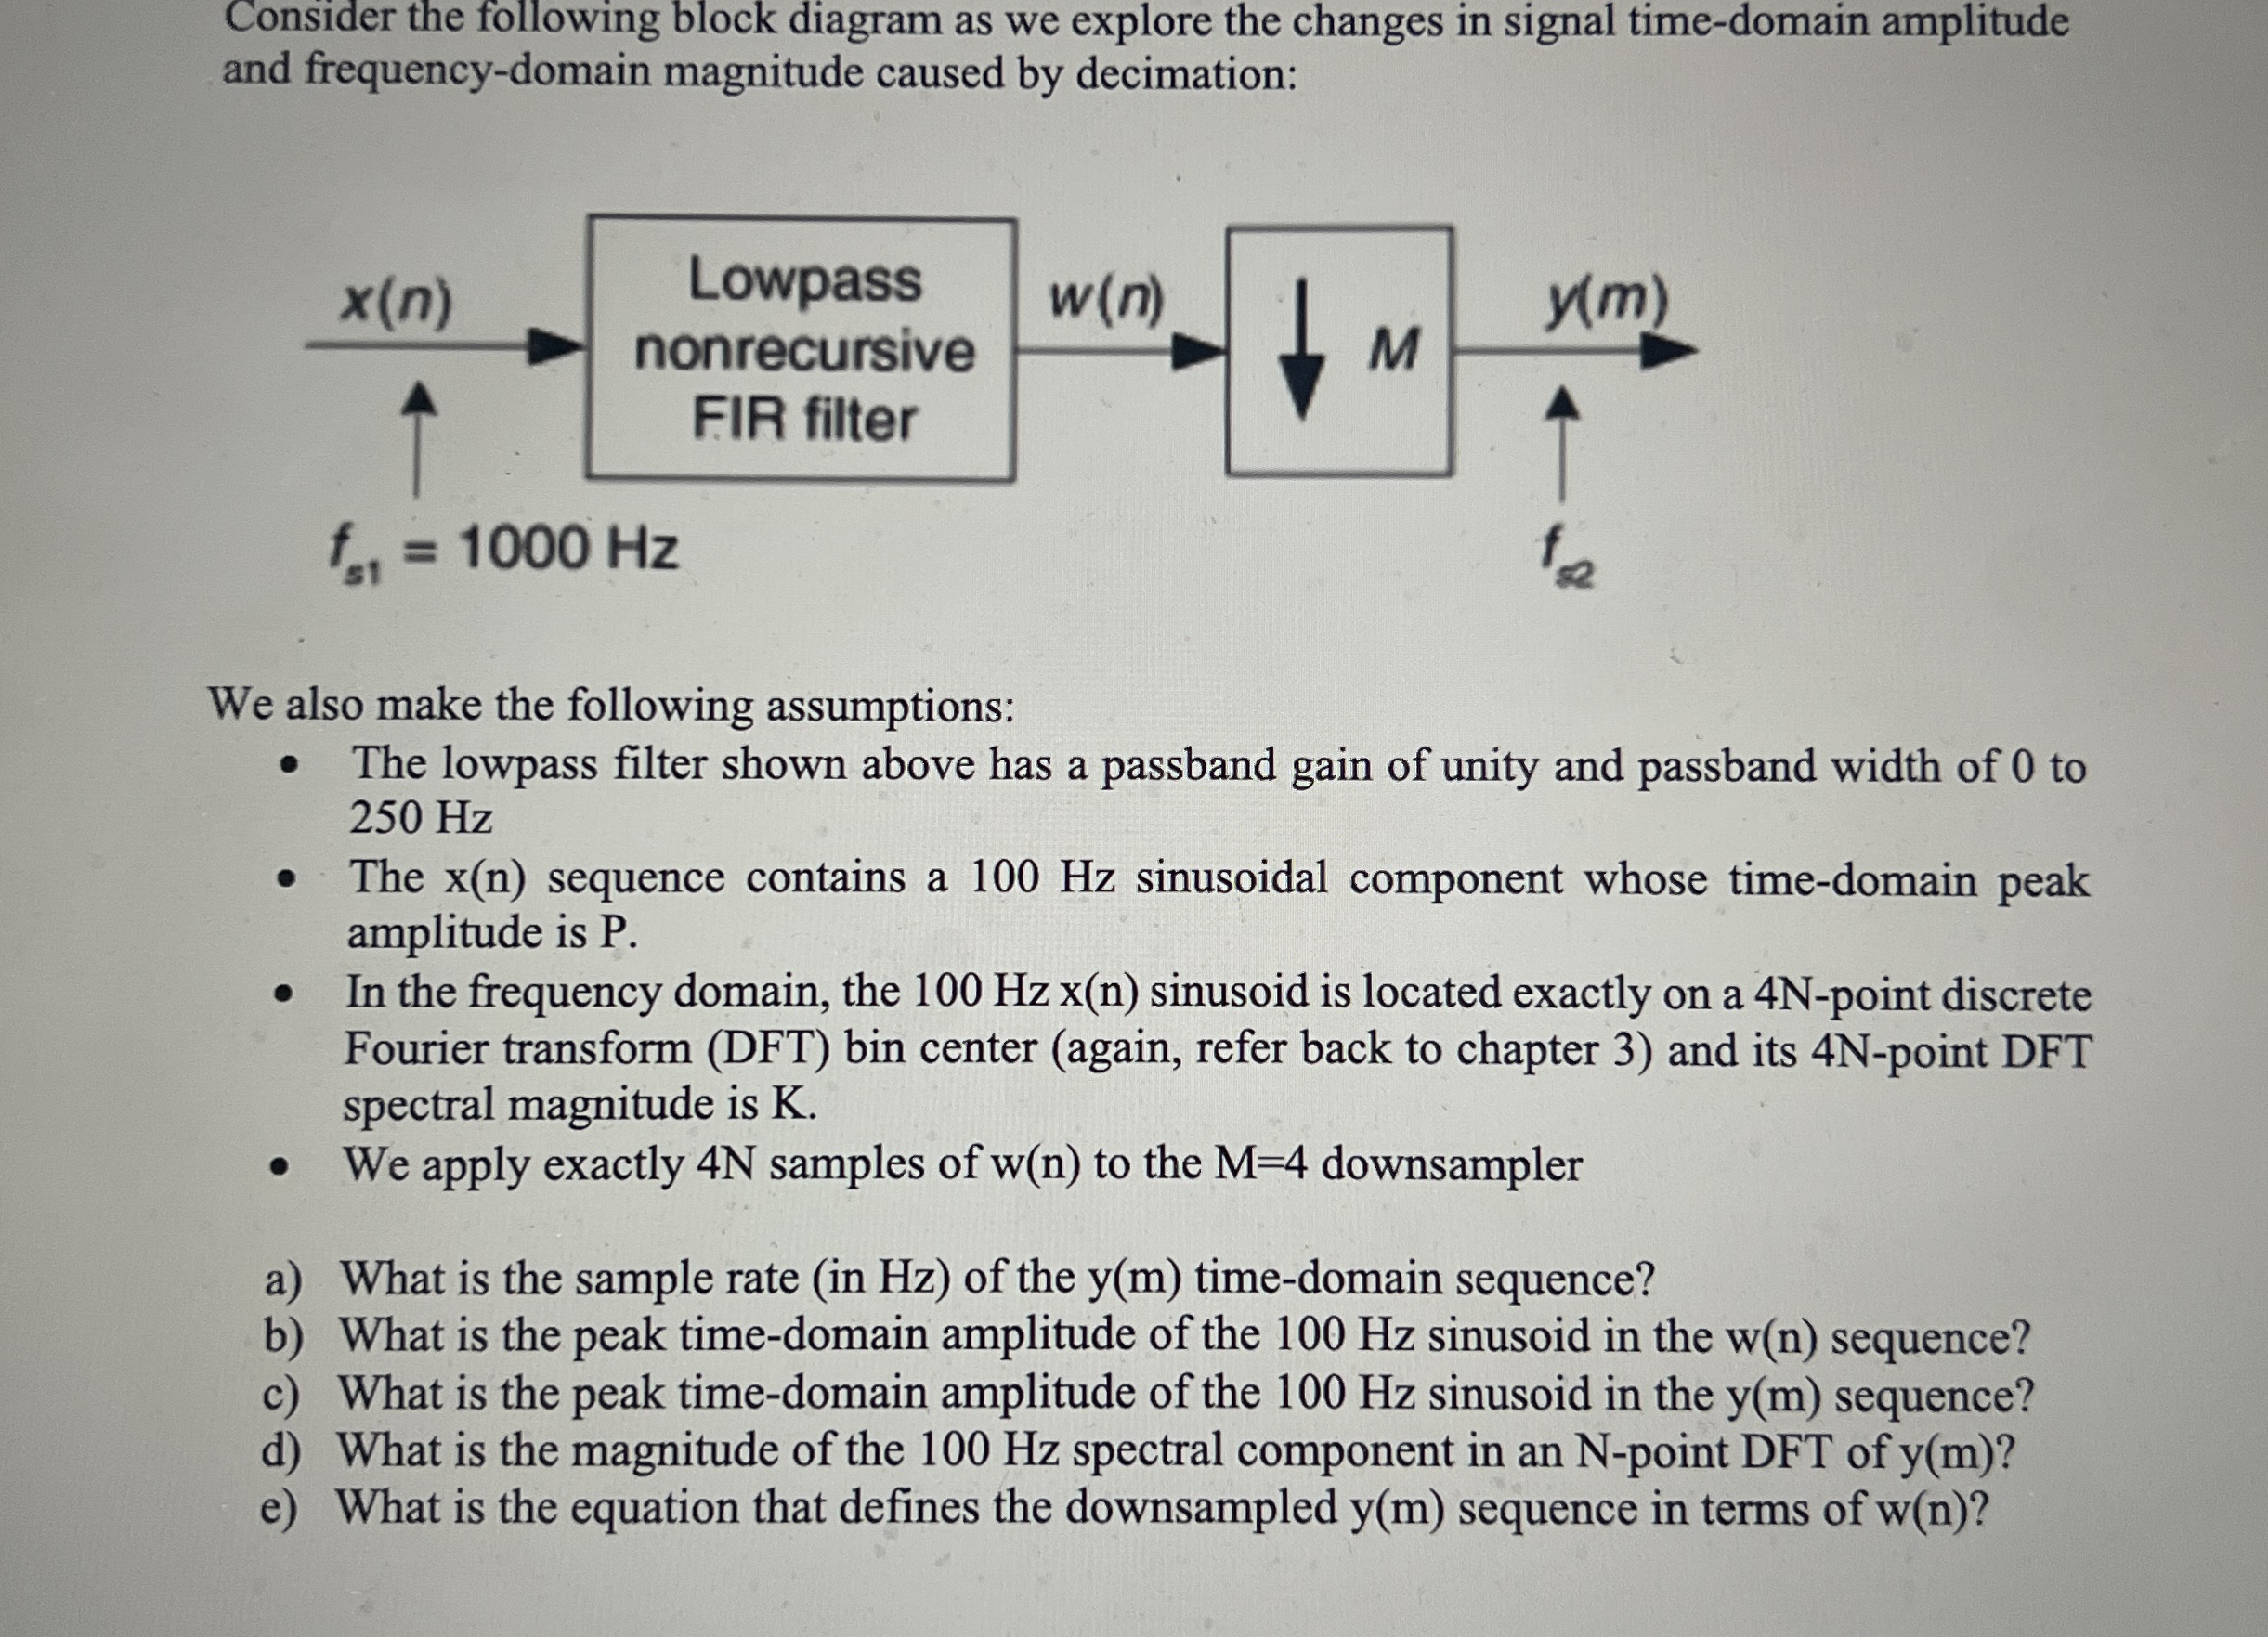
Consider the following block diagram as we explore the changes in signal timedomain amplitude and frequencydomain magnitude caused by decimation:
We also make the following assumptions:
The lowpass filter shown above has a passband gain of unity and passband width of to Hz
The sequence contains a Hz sinusoidal component whose timedomain peak amplitude is P
In the frequency domain, the sinusoid is located exactly on a N point discrete Fourier transform DFT bin center again refer back to chapter and its N point DFT spectral magnitude is K
We apply exactly N samples of to the downsampler
a What is the sample rate in Hz of the timedomain sequence?
b What is the peak timedomain amplitude of the Hz sinusoid in the sequence?
c What is the peak timedomain amplitude of the Hz sinusoid in the sequence?
d What is the magnitude of the Hz spectral component in an Npoint DFT of
e What is the equation that defines the downsampled sequence in terms of
Step by Step Solution
There are 3 Steps involved in it
1 Expert Approved Answer
Step: 1 Unlock

Question Has Been Solved by an Expert!
Get step-by-step solutions from verified subject matter experts
Step: 2 Unlock
Step: 3 Unlock