

Question: Consider the following chart. 130 120 110 100 90 80 0.8 0.9 LAS 1.0 SAS 1.1 1.2 AD GDP 1.3

Consider the following chart.
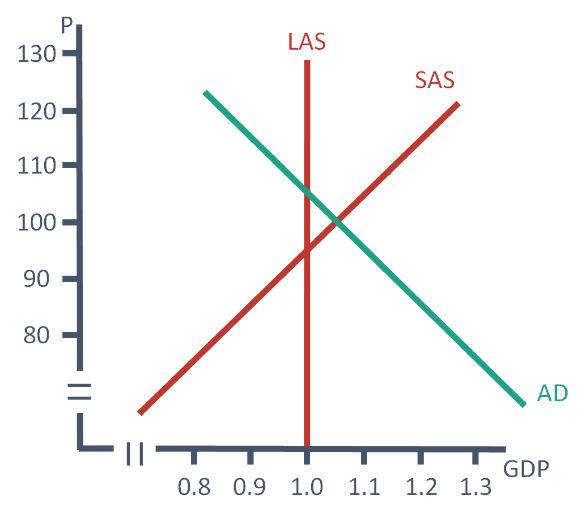
130 120 110 100 90 80 0.8 0.9 LAS 1.0 SAS 1.1 1.2 AD GDP 1.3
Step by Step Solution
There are 3 Steps involved in it
1 Expert Approved Answer
Step: 1 Unlock

Question Has Been Solved by an Expert!
Get step-by-step solutions from verified subject matter experts
Step: 2 Unlock
Step: 3 Unlock