

Question: Consider the following comparative income statement and additional balance sheet data for Van der Man Fashions, Inc. (Click the icon to view the comparative income
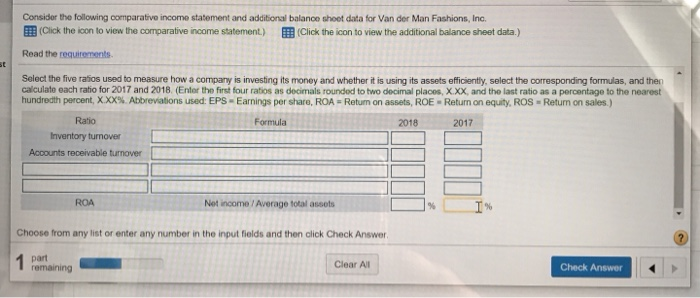
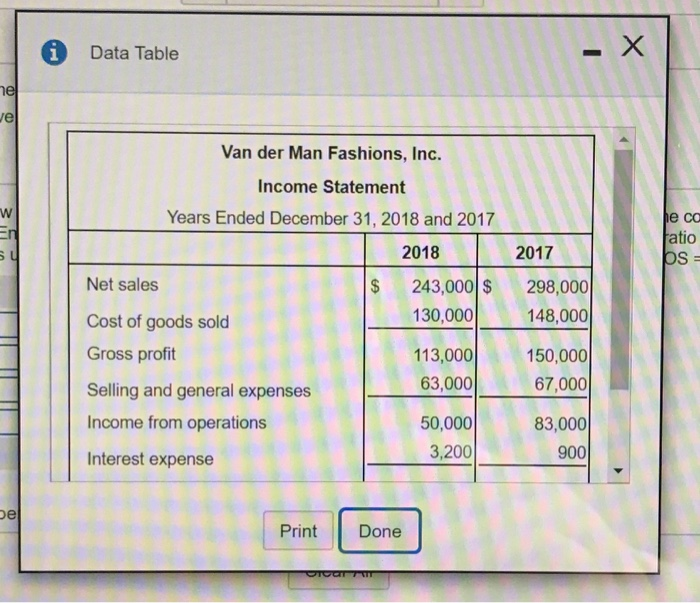
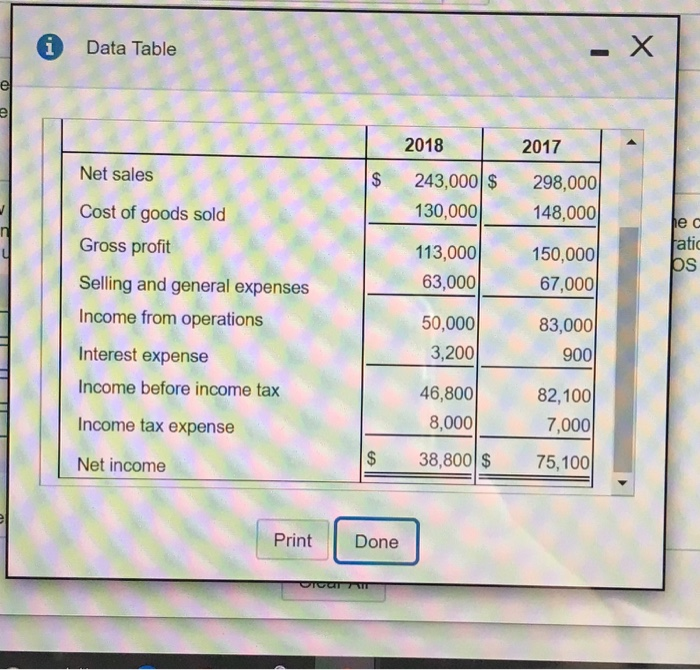
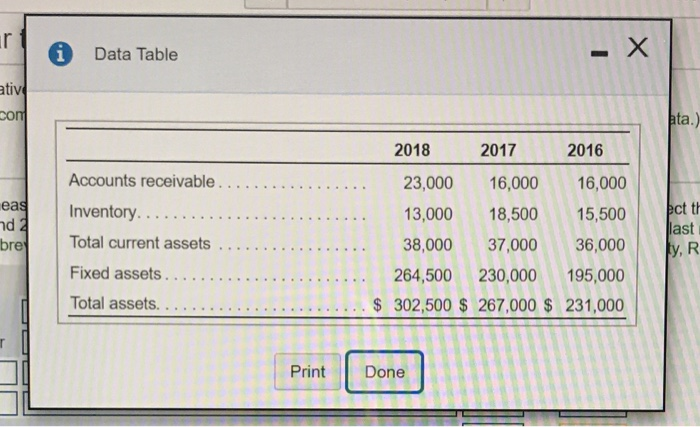
Consider the following comparative income statement and additional balance sheet data for Van der Man Fashions, Inc. (Click the icon to view the comparative income statement) Click the icon to view the additional balance sheet data) Read the requirements Select the five ratios used to measure how a company is investing its money and whether it is using its assets efficiently select the corresponding formulas, and then calculate each ratio for 2017 and 2018. (Enter the first four ratios as decimals rounded to two decimal places, X.XX, and the last ratio as a percentage to the nearest hundredth percent, XXX% Abbreviations used: EPS - Earnings per share, ROA = Return on assets, ROE - Return on equity, ROS - Return on sales.) Ratio Formula 2018 2017 Inventory turnover Accounts receivable turnover RO Not income ! Average total assets Choose from any list or enter any number in the input fields and then click Check Answer 1 part 1 remaining Clear Al Check Answer 1 . Data Table AL Van der Man Fashions, Inc. pe cc fatio I ps 3 M ST Income Statement Years Ended December 31, 2018 and 2017 2018 $ 243,000$ Cost of goods sold 130,000 Gross profit 113,000 Selling and general expenses 63,000 Income from operations 50,000 3,200 Interest expense 2017 298,000 148,000 150,000 67,000 83,000 900 Print Done Data Table Data Table I Net sales Net sales s 2018 2018 | 243,000 $ 243,000 130,000 113,000 63,000 2017 | . 298,000 148,000 hec Cost of goods sold Gross profit 13,000 fatic bs 150,000 67,000 Selling and general axorce Selling and general expenses Income from operations 50,000 3,200 83,000 9001 Interest expense Income before income tax 46,800 8.0001 82,1001 7,000 Income tax expense 38,800 $ 75,100 Net income Print Done UTUOTI Data Table ativi con (en . eas . PL 2018 2017 2016 23,000 16,000 16,000 13,000 18,500 15,500 38,000 37,000 36,000 264,500 230,000 195,000 $ 302,500 $ 267,000 $ 231,000 last Accounts receivable Inventory....... Total current assets Fixed assets Total assets. brey ly, R - - . 1 III III III. III LUI NOT TOU 1 1 1 PE JI v porre Jo as i Requirements CD = R For 2017 and 2018, compute the five ratios that measure how a business is investing its money and whether it is using its assets efficiently. Round each ratio to two decimal places. Assume all sales are on credit 2. Did the company's performance improve or deteriorate during 2018? IN Print Done And banien And
Step by Step Solution
There are 3 Steps involved in it

Get step-by-step solutions from verified subject matter experts