

Question: Consider the following computer output of a multiple regression analysis relating annual salary to years of education and years of work experience. Regression Statistics
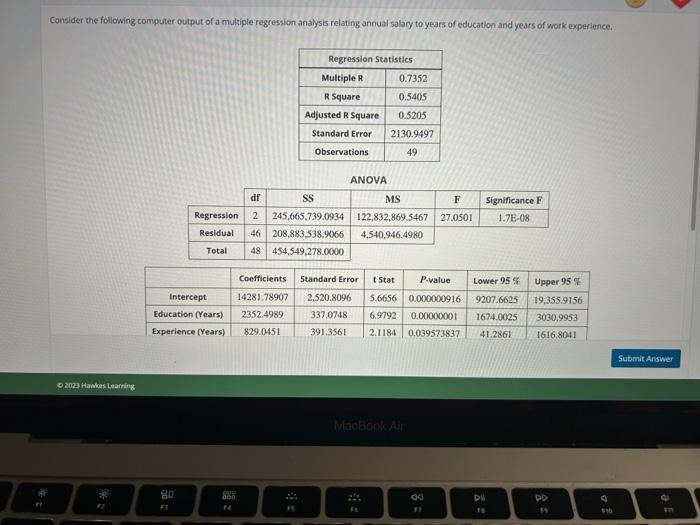
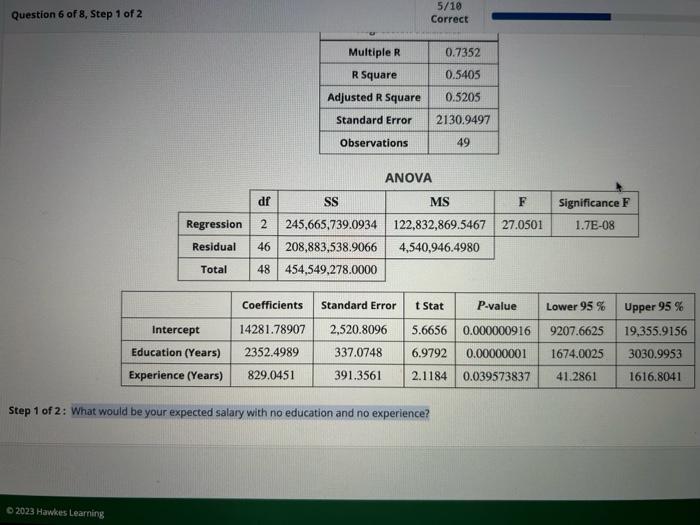
Consider the following computer output of a multiple regression analysis relating annual salary to years of education and years of work experience. Regression Statistics Multiple R 0.7352 R Square 0.5405 Adjusted R Square 0.5205 Standard Error 2130.9497 Observations 49 ANOVA df SS MS F Significance F 1.7E-08 Regression 2 245,665,739.0934 122,832,869.5467 27.0501 46 208,883,538.9066 4,540,946.4980 48 454,549,278.0000 Residual Total Intercept Education (Years) 2352.4989 Experience (Years) 829.0451 Coefficients Standard Error 14281.78907 2,520.8096 5.6656 0.000000916 337.0748 6.9792 0.00000001 391.3561 2.1184 0.039573837 41.2861 Stat P-value Lower 95% 9207.6625 1674.0025 Upper 95% 19,355.9156 3030,9953 1616.8041 Submit Answer 2023 Hawkes Learning 80. F3 MacBook Air 00 14 FA 37 8 16 8 12 F10 811 & E Question 6 of 8, Step 1 of 2 5/10 Correct Multiple R 0.7352 R Square 0.5405 Adjusted R Square 0.5205 Standard Error 2130.9497 Observations 49 ANOVA df SS MS F Significance F 1.7E-08 Regression 2 245,665,739.0934 122,832,869.5467 27.0501 Residual 46 208,883,538.9066 4,540,946.4980 Total 48 454,549,278.0000 Coefficients Standard Error t Stat P-value Lower 95 % Upper 95% Intercept 14281.78907 2,520.8096 Education (Years) 2352.4989 Experience (Years) 829.0451 337.0748 391.3561 5.6656 0.000000916 6.9792 0.00000001 9207.6625 19,355.9156 1674.0025 3030.9953 2.1184 0.039573837 41.2861 1616.8041 Step 1 of 2: What would be your expected salary with no education and no experience? 2023 Hawkes Learning
Step by Step Solution
There are 3 Steps involved in it

Get step-by-step solutions from verified subject matter experts