

Question: Consider the following data and draw the appropriate control chart. Is the process under control? Sample size Nonconformities 200 15 200 200 200 200
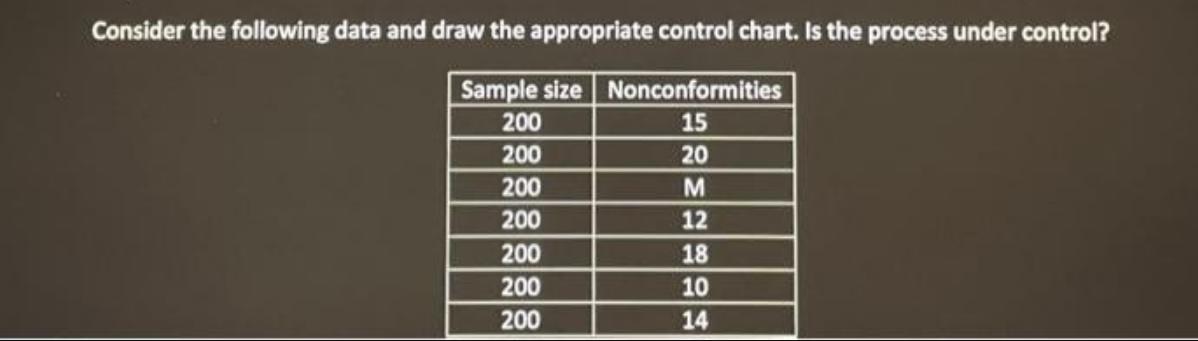
Consider the following data and draw the appropriate control chart. Is the process under control? Sample size Nonconformities 200 15 200 200 200 200 200 200 20 M 12 18 10 14
Step by Step Solution
There are 3 Steps involved in it
1 Expert Approved Answer
Step: 1 Unlock

Answer UCL X ... View full answer
Question Has Been Solved by an Expert!
Get step-by-step solutions from verified subject matter experts
Step: 2 Unlock
Step: 3 Unlock