

Question: For a construction project, the main activities are shown in table (3), the following is required: I. Using the precedence diagram method, draw the
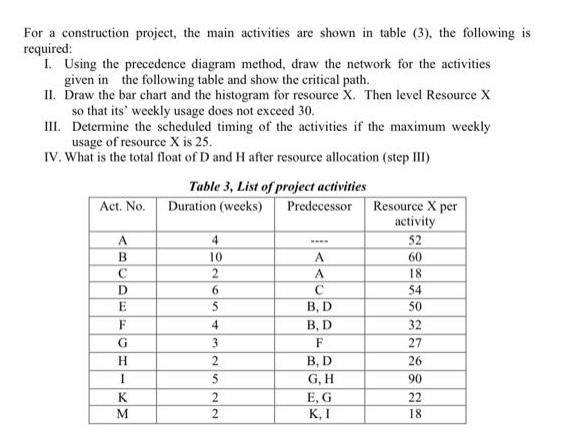
For a construction project, the main activities are shown in table (3), the following is required: I. Using the precedence diagram method, draw the network for the activities given in the following table and show the critical path. II. Draw the bar chart and the histogram for resource X. Then level Resource X so that its' weekly usage does not exceed 30. III. Determine the scheduled timing of the activities if the maximum weekly usage of resource X is 25. IV. What is the total float of D and H after resource allocation (step III) Act. No. A B D E F G H I K M Table 3, List of project activities Predecessor Duration (weeks) 4 10 2 6 5 4 3 2 5 2 2 A A B, D B, D F B, D G, H E, G K, I Resource X per activity 52 60 18 54 50 32 27 26 90 22 18
Step by Step Solution
3.50 Rating (160 Votes )
There are 3 Steps involved in it
To address each of your requirements lets start with th... View full answer

Get step-by-step solutions from verified subject matter experts