

Question: Consider the following data for a particular sample period when returns were high. The T-Bill rate is 6%. Portfolio P Portfolio M Avg Return 35.00%
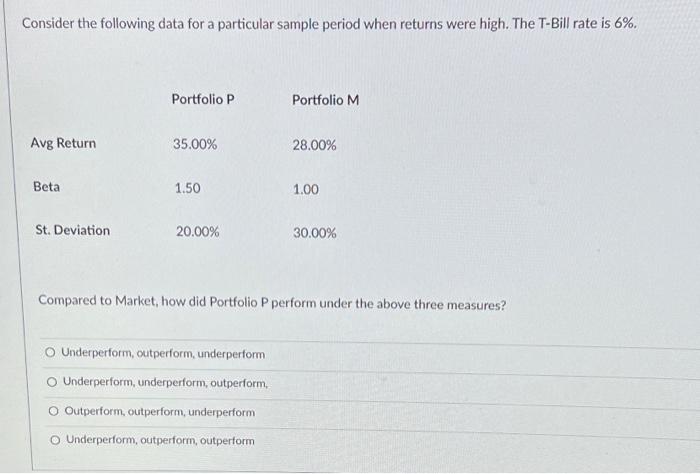
Consider the following data for a particular sample period when returns were high. The T-Bill rate is 6%. Portfolio P Portfolio M Avg Return 35.00% 28.00% Beta 1.50 1.00 St. Deviation 20.00% 30.00% Compared to Market, how did Portfolio P perform under the above three measures? Underperform, outperform underperform Underperform, underperform, outperform O Outperform, outperform, underperform o Underperform, outperform, outperform
Step by Step Solution
There are 3 Steps involved in it
1 Expert Approved Answer
Step: 1 Unlock

Question Has Been Solved by an Expert!
Get step-by-step solutions from verified subject matter experts
Step: 2 Unlock
Step: 3 Unlock