

Question: Consider the following data for two stocks: Expected return Standard deviation Stock #1 12% 2% The correlation coefficient between the two stocks is 0.3.
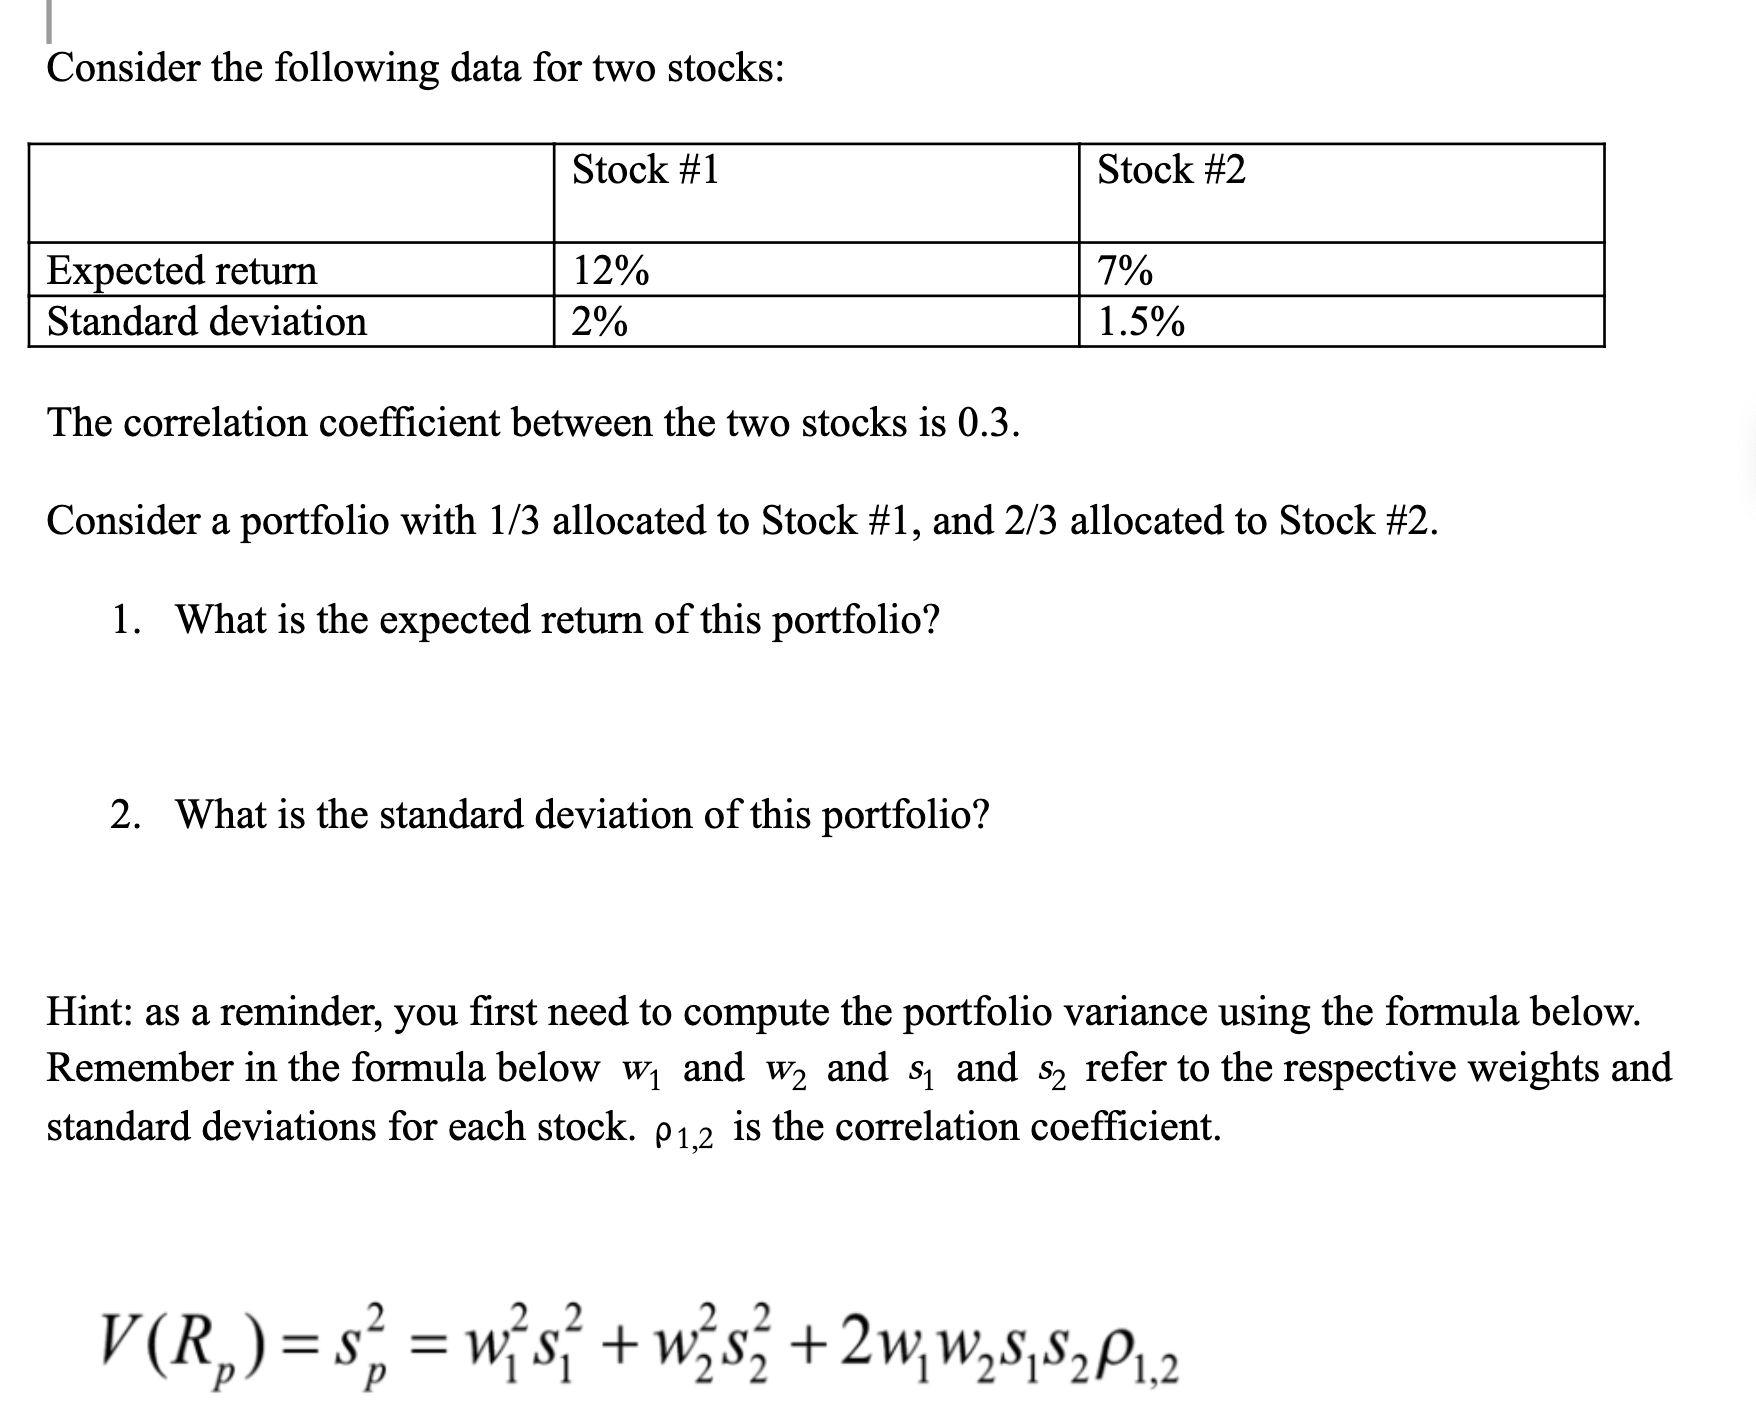
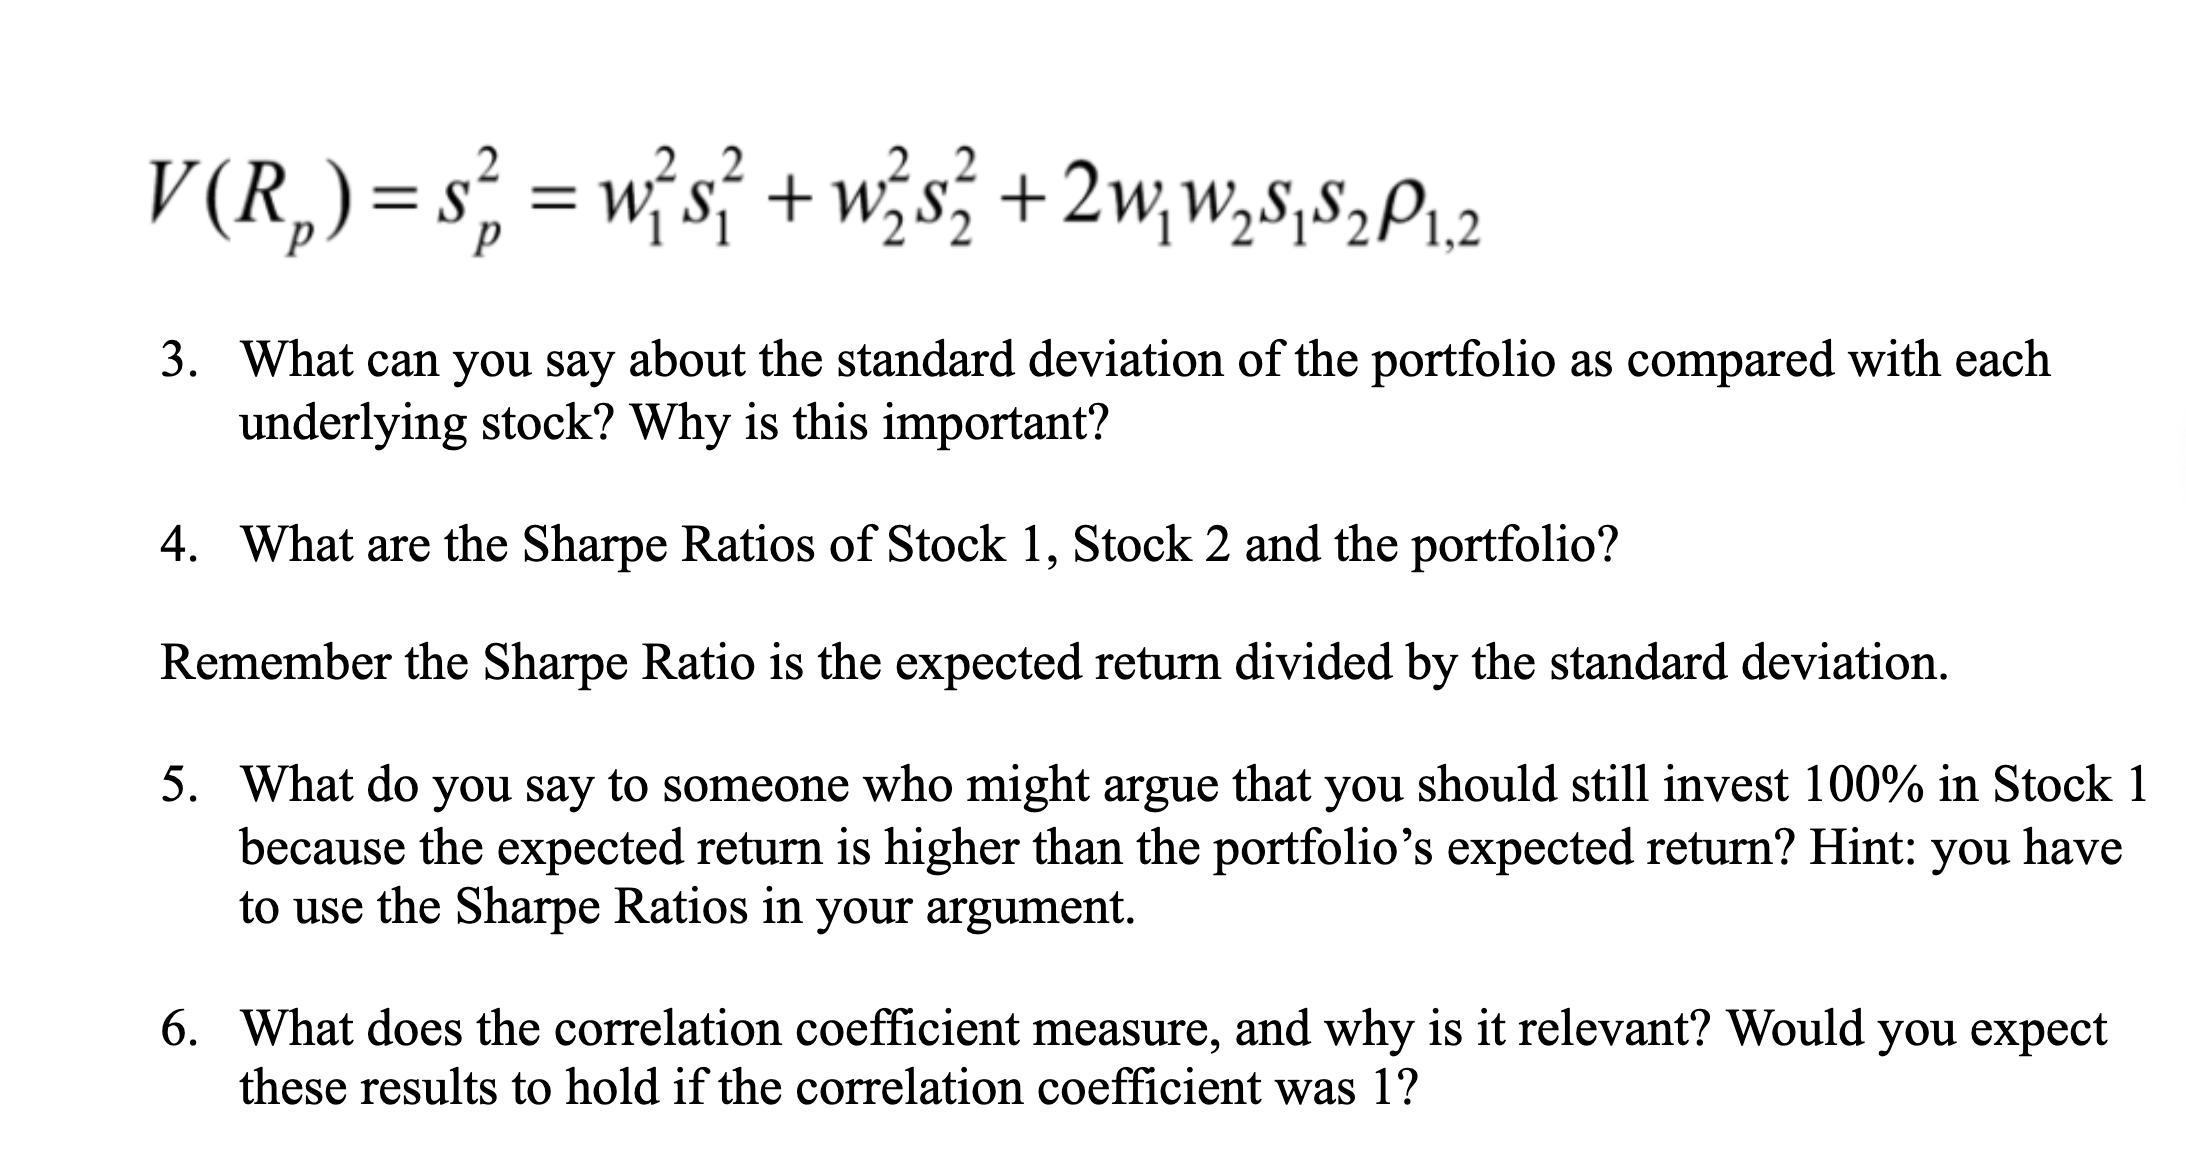
Consider the following data for two stocks: Expected return Standard deviation Stock #1 12% 2% The correlation coefficient between the two stocks is 0.3. Stock #2 2. What is the standard deviation of this portfolio? 7% 1.5% Consider a portfolio with 1/3 allocated to Stock #1, and 2/3 allocated to Stock #2. 1. What is the expected return of this portfolio? Hint: as a reminder, you first need to compute the portfolio variance using the formula below. Remember in the formula below w and and and refer to the respective weights and standard deviations for each stock. p1,2 is the correlation coefficient. 2 2 2 V (R) = s = ws + ws + 2wWSSP1,2 V (R) = s = ws + ws + 2wWSSP,2 3. What can you say about the standard deviation of the portfolio as compared with each underlying stock? Why is this important? 4. What are the Sharpe Ratios of Stock 1, Stock 2 and the portfolio? Remember the Sharpe Ratio is the expected return divided by the standard deviation. 5. What do you say to someone who might argue that you should still invest 100% in Stock 1 because the expected return is higher than the portfolio's expected return? Hint: you have to use the Sharpe Ratios in your argument. 6. What does the correlation coefficient measure, and why is it relevant? Would you expect these results to hold if the correlation coefficient was 1?
Step by Step Solution
3.51 Rating (158 Votes )
There are 3 Steps involved in it
1 Expected return of portfolio 13 012 23 007 009 9 2 Variance of portfolio 132 0022 2... View full answer

Get step-by-step solutions from verified subject matter experts