

Question: Consider the following data given in random order for GD Inc. at December 31, 2018, the end of its fiscal year: Revenues Cash Accounts
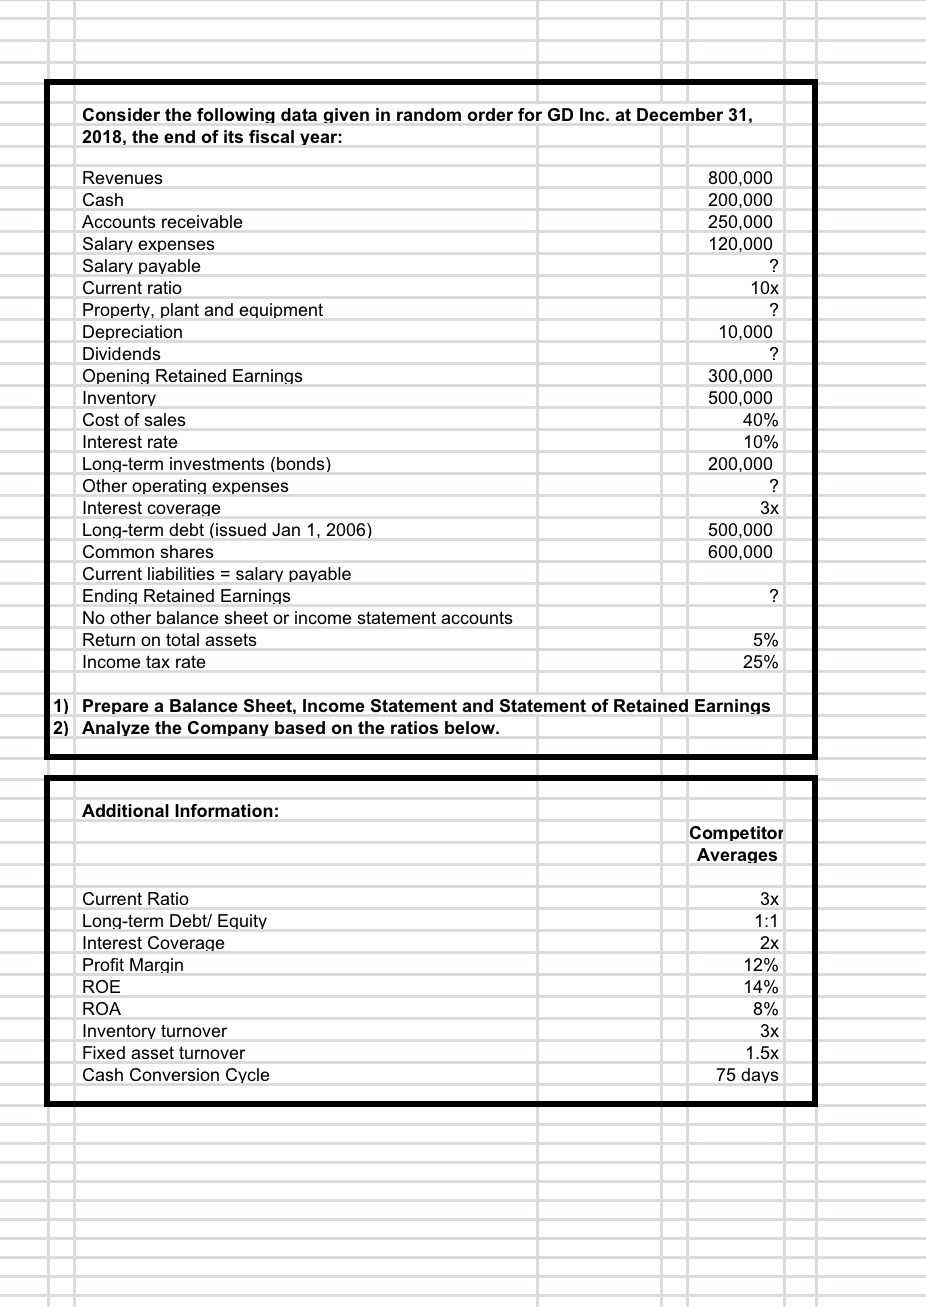
Consider the following data given in random order for GD Inc. at December 31, 2018, the end of its fiscal year: Revenues Cash Accounts receivable Salary expenses Salary payable Current ratio Property, plant and equipment Depreciation Dividends Opening Retained Earnings Inventory Cost of sales Interest rate Long-term investments (bonds) Other operating expenses Interest coverage Long-term debt (issued Jan 1, 2006) Common shares Current liabilities = salary payable Ending Retained Earnings No other balance sheet or income statement accounts Return on total assets Income tax rate 800,000 200,000 250,000 120,000 ? 10x ? 10,000 ? 300,000 500,000 40% 10% 200,000 ? 3x 500,000 600,000 ? 5% 25% 1) Prepare a Balance Sheet, Income Statement and Statement of Retained Earnings 2) Analyze the Company based on the ratios below. Additional Information: Current Ratio Long-term Debt/Equity Interest Coverage Profit Margin ROE ROA Inventory turnover Fixed asset turnover Cash Conversion Cycle Competitor Averages 3x 1:1 2x 12% 14% 8% 3x 1.5x 75 days Consider the following data given in random order for GD Inc. at December 31, 2018, the end of its fiscal year: Revenues Cash Accounts receivable Salary expenses Salary payable Current ratio Property, plant and equipment Depreciation Dividends Opening Retained Earnings Inventory Cost of sales Interest rate Long-term investments (bonds) Other operating expenses Interest coverage Long-term debt (issued Jan 1, 2006) Common shares Current liabilities = salary payable Ending Retained Earnings No other balance sheet or income statement accounts Return on total assets Income tax rate 800,000 200,000 250,000 120,000 ? 10x ? 10,000 ? 300,000 500,000 40% 10% 200,000 ? 3x 500,000 600,000 ? 5% 25% 1) Prepare a Balance Sheet, Income Statement and Statement of Retained Earnings 2) Analyze the Company based on the ratios below. Additional Information: Current Ratio Long-term Debt/Equity Interest Coverage Profit Margin ROE ROA Inventory turnover Fixed asset turnover Cash Conversion Cycle Competitor Averages 3x 1:1 2x 12% 14% 8% 3x 1.5x 75 days
Step by Step Solution
3.50 Rating (163 Votes )
There are 3 Steps involved in it
contains data for GD Inc at the end of its fiscal year December 31 2018 Based on this data you can prepare a balance sheet income statement and statement of retained earnings and then analyze the comp... View full answer

Get step-by-step solutions from verified subject matter experts