

Question: Consider the following data on X = rainfall volume (m3) and y = runoff volume (m3) for a particular location. X 4 12 14 16
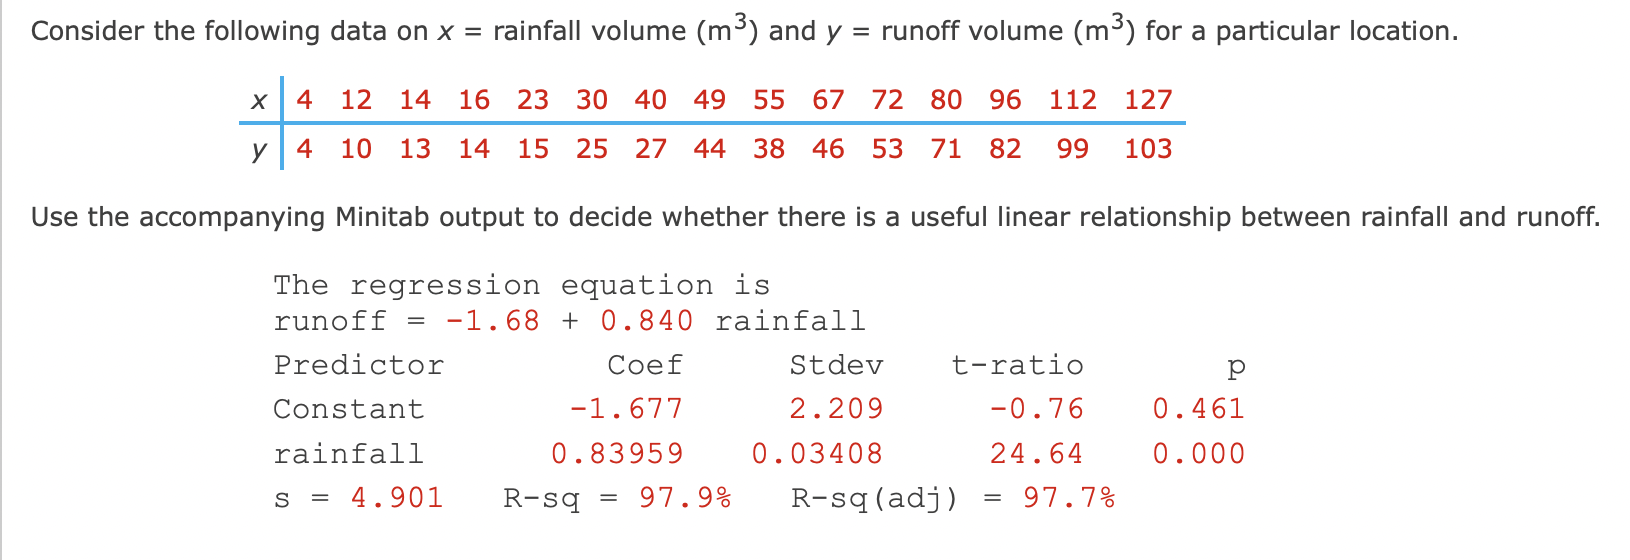


Consider the following data on X = rainfall volume (m3) and y = runoff volume (m3) for a particular location. X 4 12 14 16 23 30 40 49 55 67 72 80 96 112 127 y 4 10 13 14 15 25 27 44 38 46 53 71 82 99 103 Use the accompanying Minitab output to decide whether there is a useful linear relationship between rainfall and runoff. The regression equation is runoff = -1.68 + 0.840 rainfall Predictor Coef Stdev tratio p Constant -l.677 2.209 0.76 0.461 rainfall 0.83959 0.03408 24.64 0.000 s = 4.901 Rsq = 97.9% Rsqladj) = 97.7% Compute the test statistic value and find the P-value. (Round your test statistic to two decimal places and your P-value to three decimal places.) t = 22.91 X P-value = 0.0000Calculate a 95% condence interval for the true average change in runoff volume associated with a 1 m3 increase in rainfall volume. (Round your answers to three decimal places.) 0.754 x ,0.911 x m3 ( )
Step by Step Solution
There are 3 Steps involved in it

Get step-by-step solutions from verified subject matter experts