

Question: Consider the following data sample from the Consumer Reports Restaurant Satisfaction Survey where variable Type indicates whether the restaurant is Italian or a Seafood/steakhouse restaurant.
Consider the following data sample from the Consumer Reports Restaurant Satisfaction Survey where variable Type indicates whether the restaurant is Italian or a Seafood/steakhouse restaurant. Price indicates average amount paid per person for dinner and drinks. Score reflects diners overall satisfaction, with higher values indicating greater satisfaction (100 is completely satisfied). A regression analysis is conducted using several steps to gauge the impact of the explanatory variables on Score (diner satisfaction).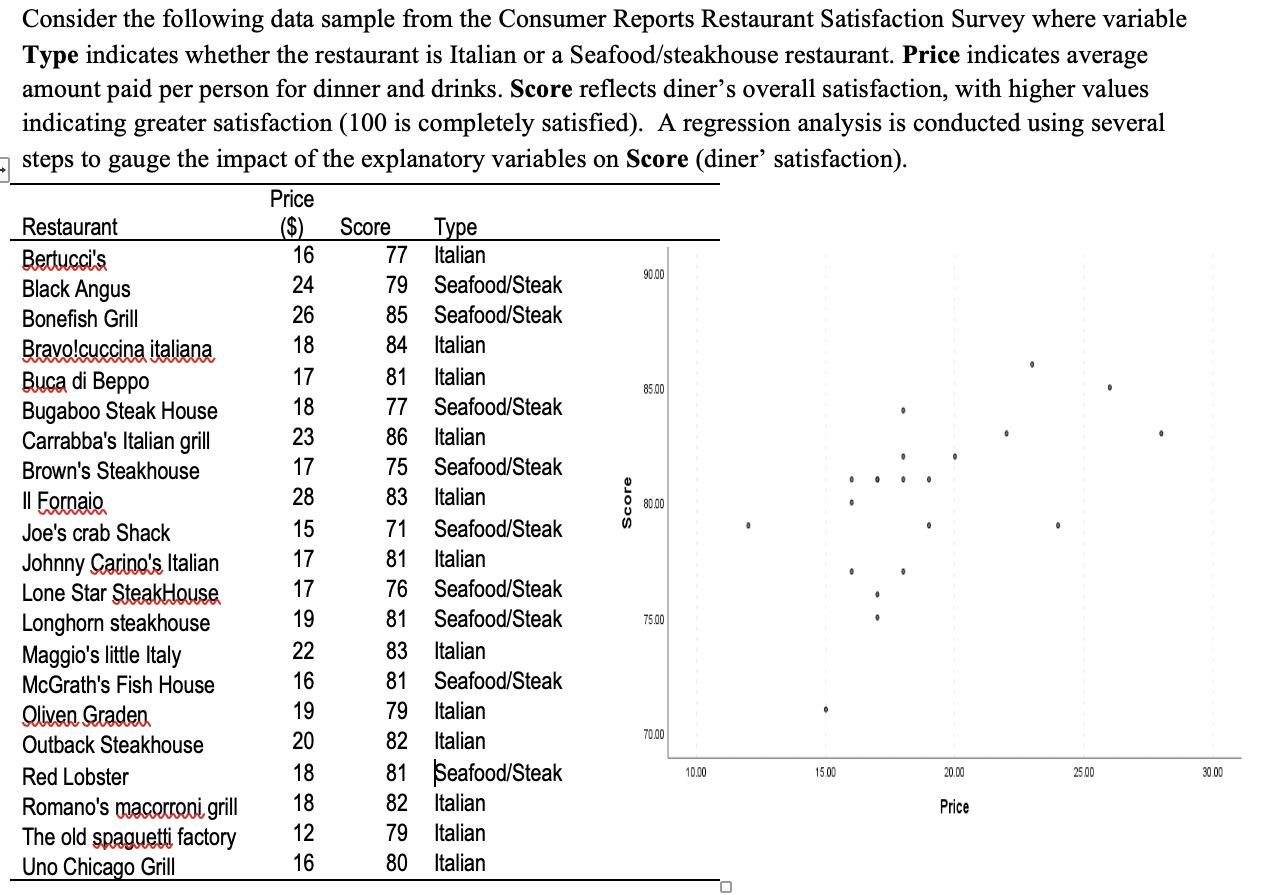
MODEL 1- includes only the Price to explain Score
(1pt) Comment on the goodness of fit of MODEL 1. Fully explain here
(1pt) Report the statistical significance of MODEL 1 Fully explain here:
90.00 85.00 Consider the following data sample from the Consumer Reports Restaurant Satisfaction Survey where variable Type indicates whether the restaurant is Italian or a Seafood/steakhouse restaurant. Price indicates average amount paid per person for dinner and drinks. Score reflects diner's overall satisfaction, with higher values indicating greater satisfaction (100 is completely satisfied). A regression analysis is conducted using several steps to gauge the impact of the explanatory variables on Score (diner satisfaction). Price Restaurant ($) Score Type Bertucci's 16 77 Italian Black Angus 24 79 Seafood/Steak Bonefish Grill 26 85 Seafood/Steak Bravo!cuccina italiana 18 84 Italian Buca di Beppo 17 81 Italian Bugaboo Steak House 18 77 Seafood/Steak Carrabba's Italian grill 23 86 Italian Brown's Steakhouse 17 75 Seafood/Steak Il Fornaio 28 83 Italian Joe's crab Shack 15 71 Seafood/Steak Johnny Carino's Italian 17 81 Italian Lone Star Steak House 17 76 Seafood/Steak Longhorn steakhouse 19 81 Seafood/Steak Maggio's little Italy 22 83 Italian McGrath's Fish House 16 81 Seafood/Steak Oliven Graden 19 79 Italian Outback Steakhouse 20 82 Italian Red Lobster 18 81 Seafood/Steak 25.00 Romano's macorroni grill 18 82 Italian Price The old spaguetti factory 12 79 Italian Uno Chicago Grill 16 80 Italian Score Score 80.00 75.00 70.00 10.00 15.00 20.00 30.00 O 90.00 85.00 Consider the following data sample from the Consumer Reports Restaurant Satisfaction Survey where variable Type indicates whether the restaurant is Italian or a Seafood/steakhouse restaurant. Price indicates average amount paid per person for dinner and drinks. Score reflects diner's overall satisfaction, with higher values indicating greater satisfaction (100 is completely satisfied). A regression analysis is conducted using several steps to gauge the impact of the explanatory variables on Score (diner satisfaction). Price Restaurant ($) Score Type Bertucci's 16 77 Italian Black Angus 24 79 Seafood/Steak Bonefish Grill 26 85 Seafood/Steak Bravo!cuccina italiana 18 84 Italian Buca di Beppo 17 81 Italian Bugaboo Steak House 18 77 Seafood/Steak Carrabba's Italian grill 23 86 Italian Brown's Steakhouse 17 75 Seafood/Steak Il Fornaio 28 83 Italian Joe's crab Shack 15 71 Seafood/Steak Johnny Carino's Italian 17 81 Italian Lone Star Steak House 17 76 Seafood/Steak Longhorn steakhouse 19 81 Seafood/Steak Maggio's little Italy 22 83 Italian McGrath's Fish House 16 81 Seafood/Steak Oliven Graden 19 79 Italian Outback Steakhouse 20 82 Italian Red Lobster 18 81 Seafood/Steak 25.00 Romano's macorroni grill 18 82 Italian Price The old spaguetti factory 12 79 Italian Uno Chicago Grill 16 80 Italian Score Score 80.00 75.00 70.00 10.00 15.00 20.00 30.00 O
Step by Step Solution
There are 3 Steps involved in it

Get step-by-step solutions from verified subject matter experts