

Question: Consider the following data set that contains information about a sample of ten 2016 Toyota Rav4 offered for sale providing the mileage and price
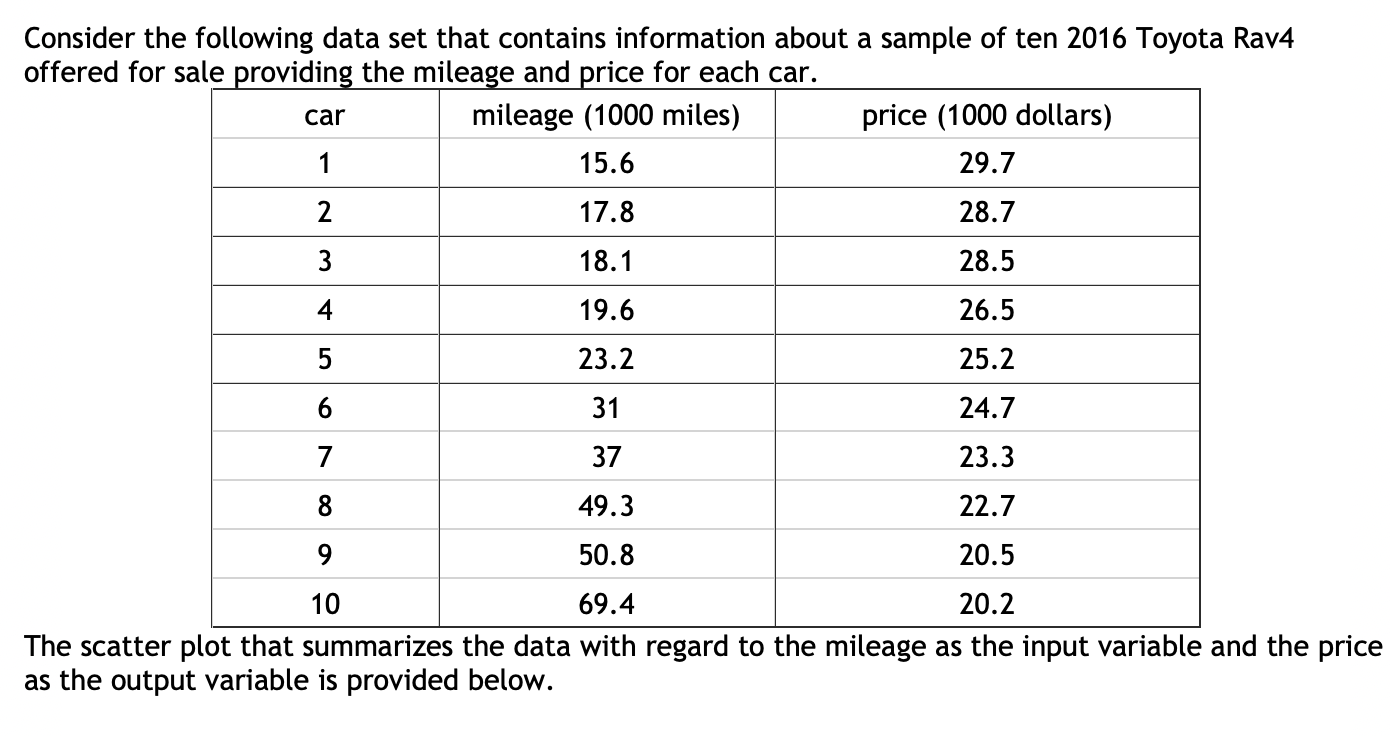
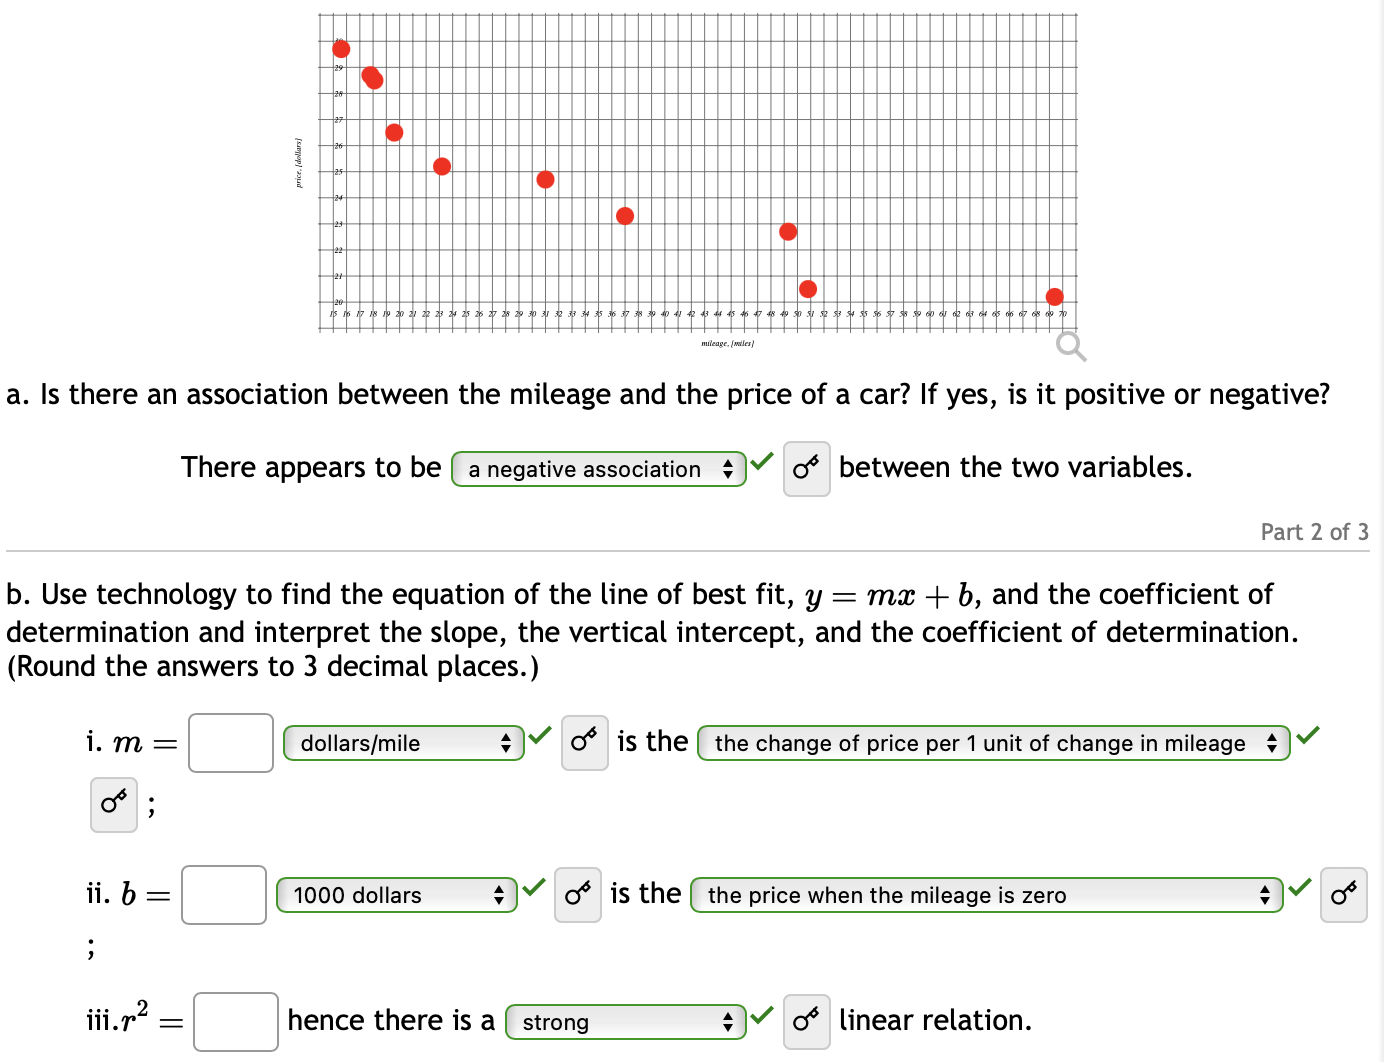
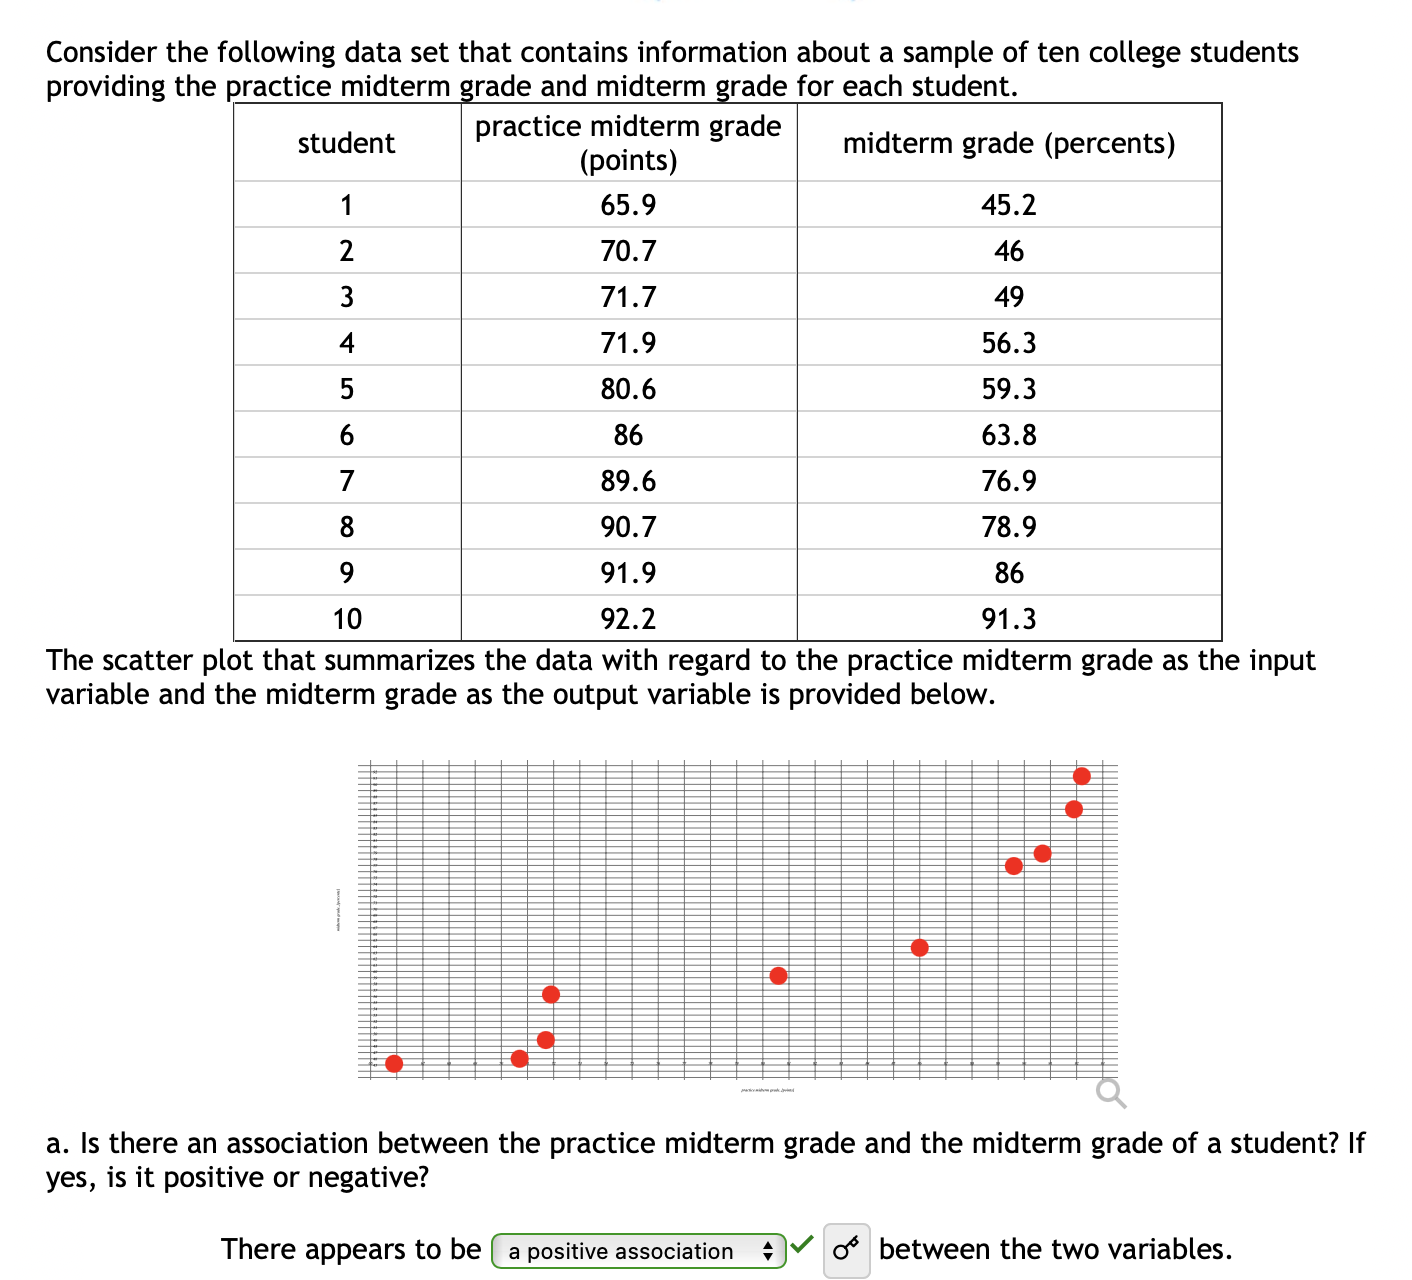
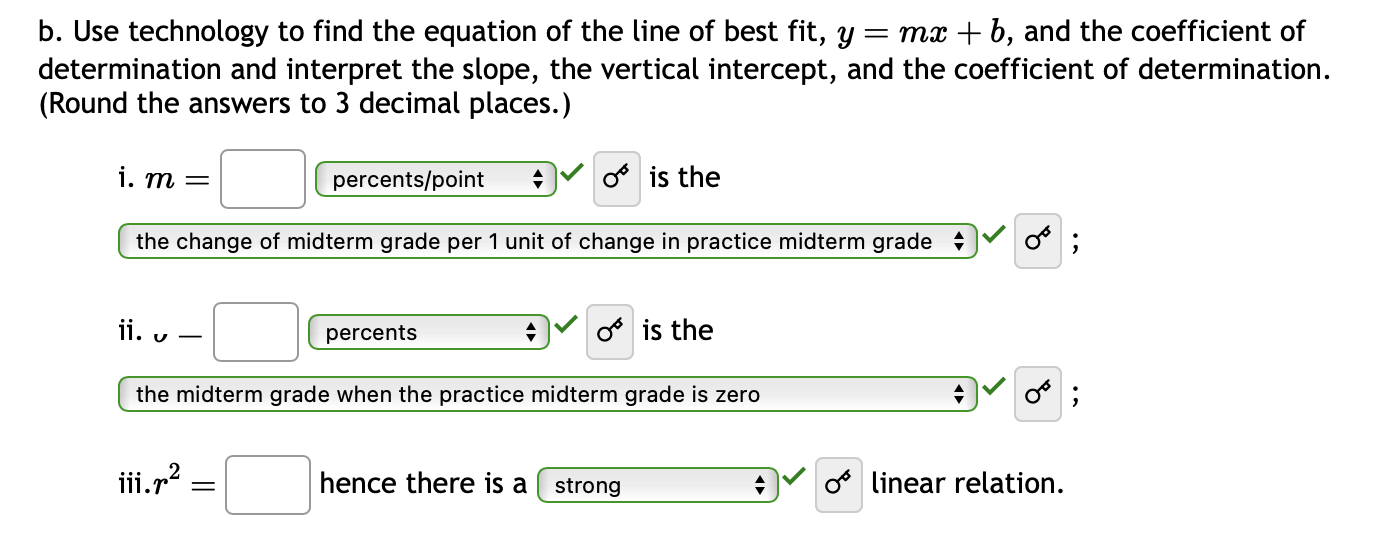
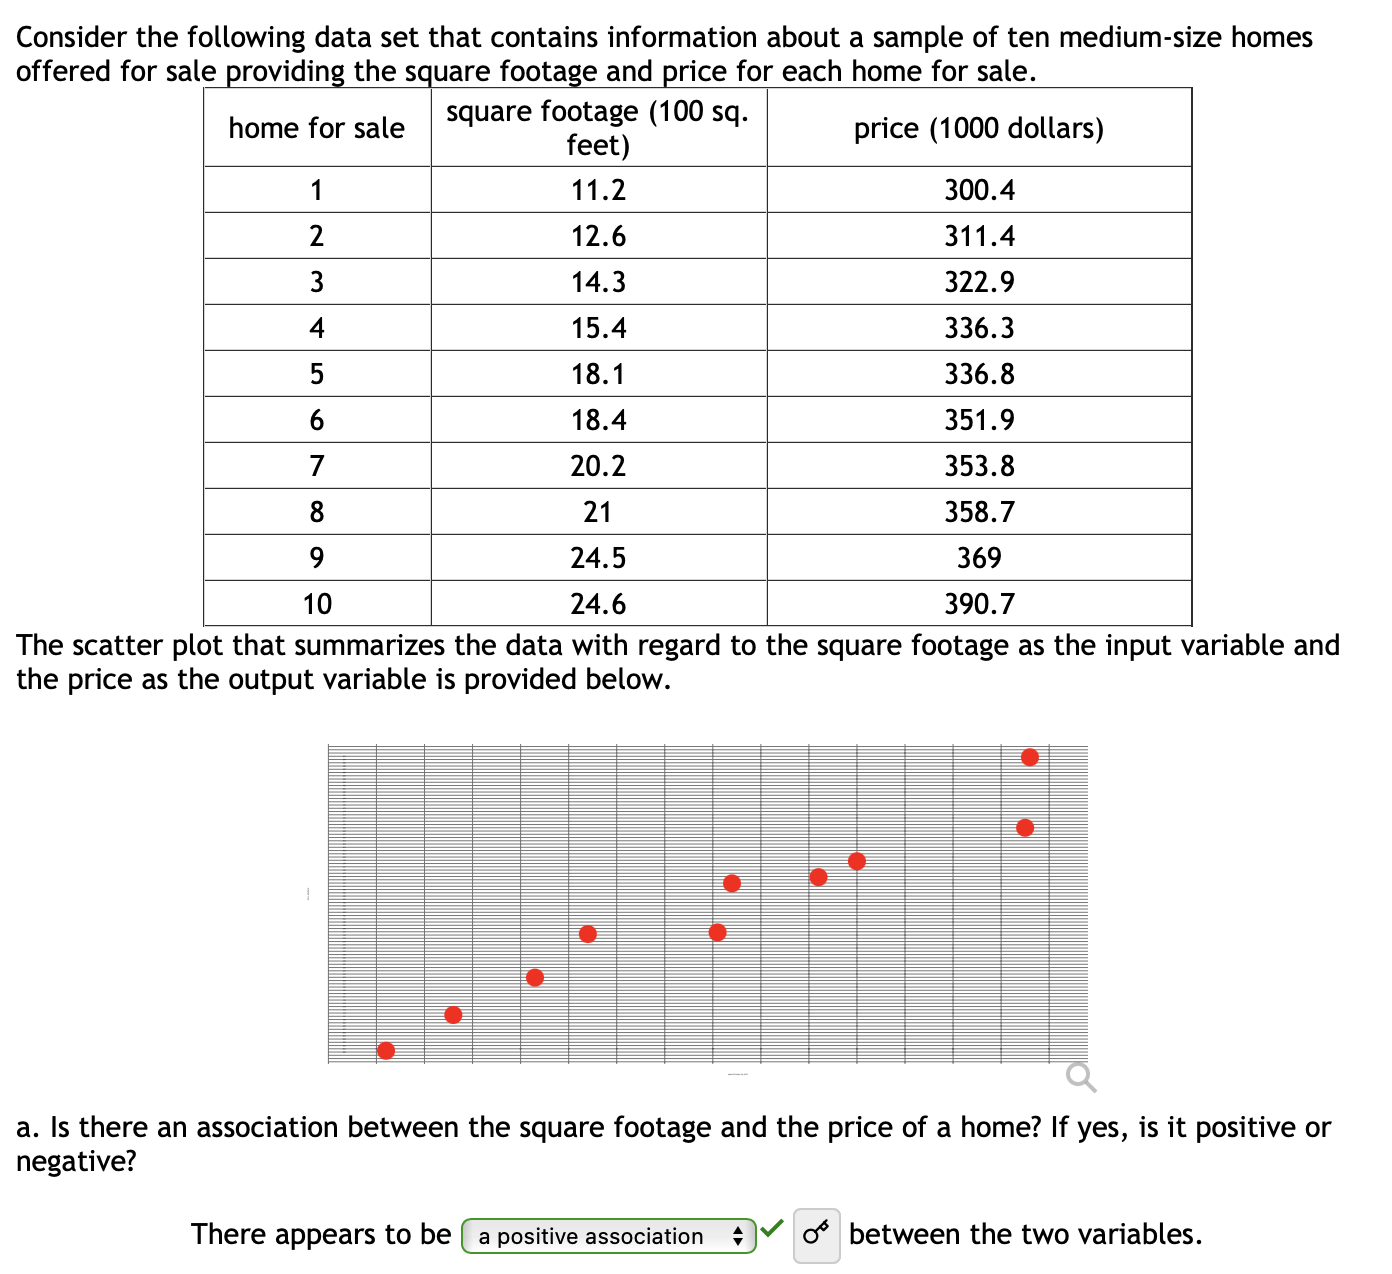
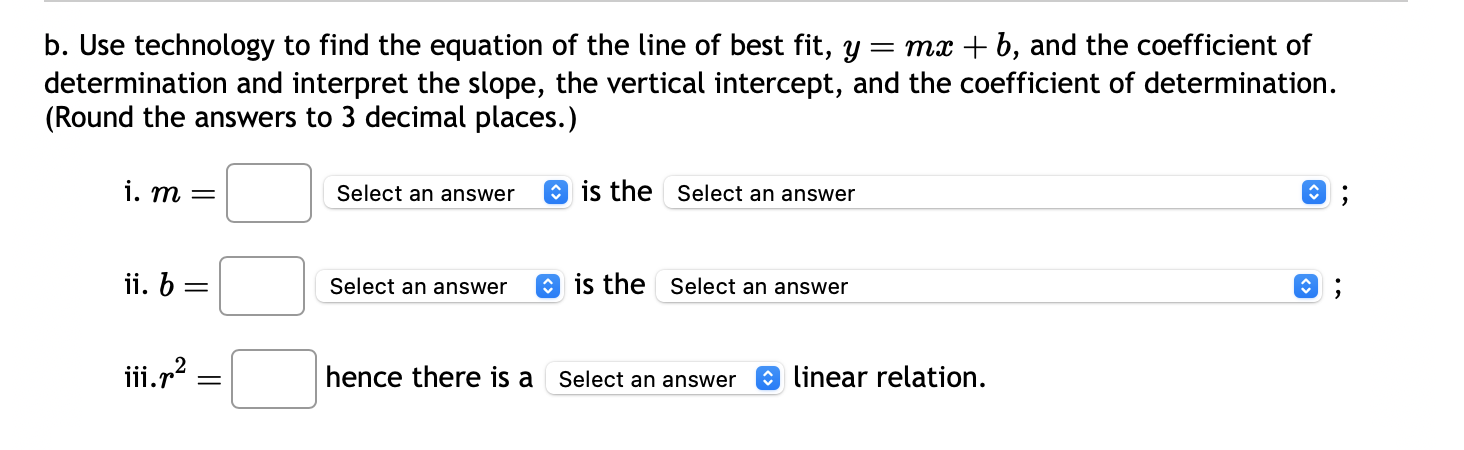
Consider the following data set that contains information about a sample of ten 2016 Toyota Rav4 offered for sale providing the mileage and price for each car. car mileage (1000 miles) price (1000 dollars) 1 15.6 29.7 2 17.8 28.7 3 18.1 28.5 4 19.6 26.5 5 23.2 25.2 6 31 24.7 7 37 23.3 8 49.3 22.7 9 50.8 20.5 10 69.4 20.2 The scatter plot that summarizes the data with regard to the mileage as the input variable and the price as the output variable is provided below. price, [dollars] mileage, (miles) a. Is there an association between the mileage and the price of a car? If yes, is it positive or negative? There appears to be a negative association + between the two variables. Part 2 of 3 b. Use technology to find the equation of the line of best fit, y =mx+b, and the coefficient of determination and interpret the slope, the vertical intercept, and the coefficient of determination. (Round the answers to 3 decimal places.) i. m = dollars/mile is the the change of price per 1 unit of change in mileage + ii. b = 1000 dollars 0 is the the price when the mileage is zero = hence there is a strong o linear relation. Consider the following data set that contains information about a sample of ten college students providing the practice midterm grade and midterm grade for each student. practice midterm grade student midterm grade (percents) (points) 1 65.9 45.2 2 70.7 46 3 71.7 49 4 71.9 56.3 5 80.6 59.3 6 86 63.8 7 89.6 76.9 8 90.7 78.9 9 91.9 86 10 92.2 91.3 The scatter plot that summarizes the data with regard to the practice midterm grade as the input variable and the midterm grade as the output variable is provided below. a. Is there an association between the practice midterm grade and the midterm grade of a student? If yes, is it positive or negative? There appears to be a positive association between the two variables. b. Use technology to find the equation of the line of best fit, y = mx + b, and the coefficient of determination and interpret the slope, the vertical intercept, and the coefficient of determination. (Round the answers to 3 decimal places.) i. m = percents/point O is the the change of midterm grade per 1 unit of change in practice midterm grade + ii. 1 - percents is the the midterm grade when the practice midterm grade is zero iii.r = hence there is a strong ; 0+ o linear relation. ; Consider the following data set that contains information about a sample of ten medium-size homes offered for sale providing the square footage and price for each home for sale. price (1000 dollars) square footage (100 sq. home for sale feet) 1 11.2 300.4 2 12.6 311.4 3 14.3 322.9 4 15.4 336.3 5 18.1 336.8 6 18.4 351.9 7 20.2 353.8 8 21 358.7 9 10 24.5 369 24.6 390.7 The scatter plot that summarizes the data with regard to the square footage as the input variable and the price as the output variable is provided below. a. Is there an association between the square footage and the price of a home? If yes, is it positive or negative? There appears to be a positive association between the two variables. b. Use technology to find the equation of the line of best fit, y = mx + b, and the coefficient of determination and interpret the slope, the vertical intercept, and the coefficient of determination. (Round the answers to 3 decimal places.) i. m = Select an answer is the Select an answer ii. b = Select an answer is the Select an answer iii.r = hence there is a Select an answer linear relation.
Step by Step Solution
There are 3 Steps involved in it

Get step-by-step solutions from verified subject matter experts